Since 'Ellipsometry' objects compute two quantities the graphics settings are more complicated as in the case of 'R,T,ATR' objects.
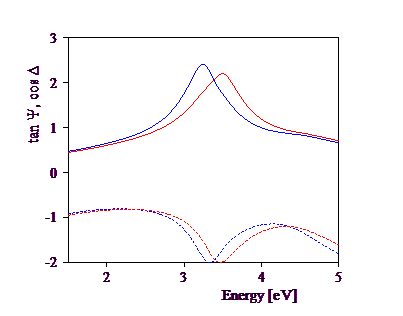
In principle, there are two independent graphs with corresponding graphics parameters, one for the quantity related to Ψ (Ψ itself, or tan(Ψ)) and one for Δ (or cos(Δ)). However, the easiest handling of the data display is achieved with the default settings. These couple the two sets of graphics parameters to be the same except for the frame mode. This is set to 0 for the Δ graphics. A typical display is the following:

The simulated spectrum of tan(Ψ) is drawn in a blue solid line, the corresponding experimental data are in red (also using a solid line). The cos(Δ) curves are dashed (blue for the simulation, red for the measured data).
The check box 'Lock graphics' is checked in the default configuration. This means that zoom and stretching operations affect both spectra, tan(Ψ) and cos(Δ), the same way.
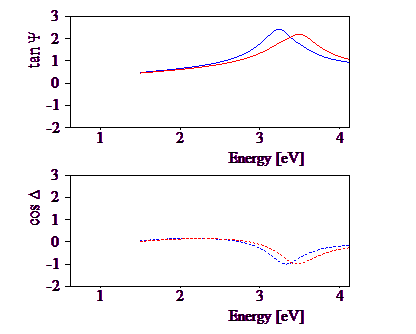
You can also edit the graphics parameters for Δ (command Graphics|Delta) and set the frame mode to a value larger than 0. This way you can generate two coordinate systems like in the following example:

If 'Lock graphics' is still checked the key and mouse commands to move through the graphics still apply to both graphs. For example, a pressing the left cursor key leads to this:

If you uncheck the 'Lock graphics' box all key and mouse commnds apply to the Ψ curve only. The key command mentioned above would lead to the following appearance:

In this case, there are no quick graphics commands for the Δ spectrum in the present SCOUT version.