Tabsheets Overview and Zoom |
  
|
Tabsheets Overview and Zoom |
|
These 2 tabsheets give a graphical representation of the BREIN system, showing the factory, the coating line, the deposition devices and the various bright eye stations:
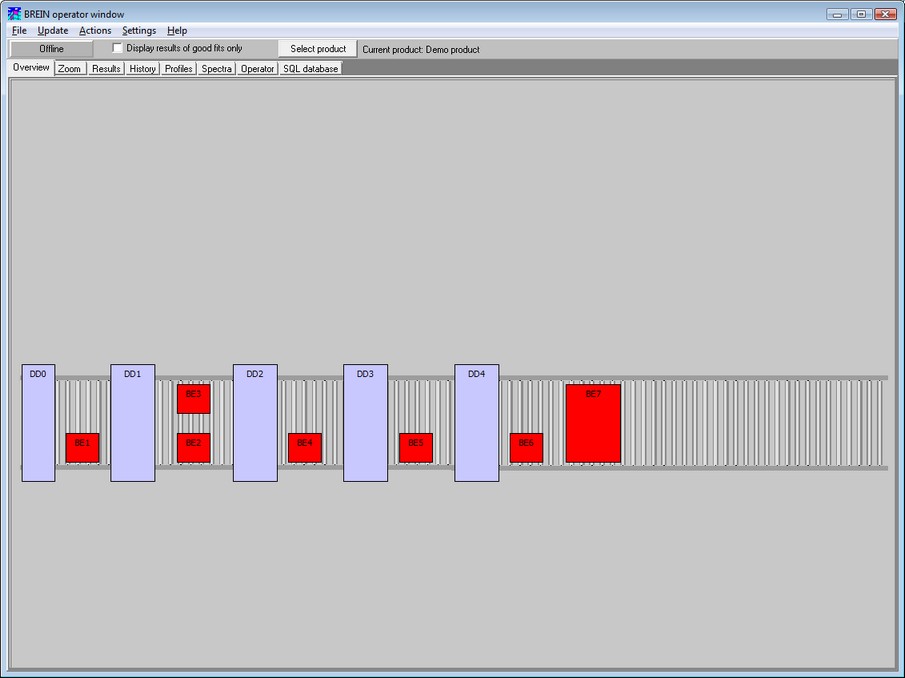
A mouse click on an object pops up a dialog showing the object's parameters that can be changed. The most important objects are the deposition devices and the bright eyes.
Clicking on a deposition device brings up the following dialog:
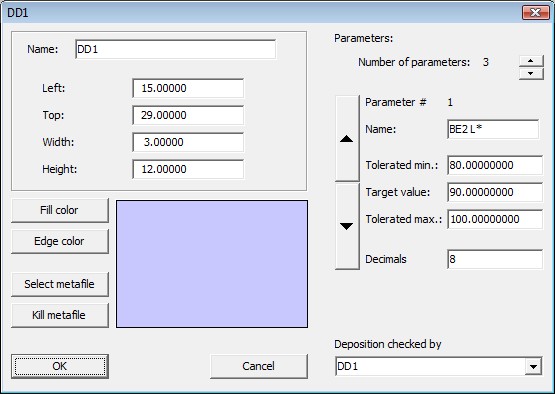
The left side of the dialog is used to set the position and appearance of the object in the Overview and Zoom tabsheets. Usually there is no need to modify these settings.
On the right side you can modify the parameters that belong to this deposition device. Usually the parameters are thickness values of deposited layers. Using the large up and down arrow buttons you select a parameter, and then you set the target value, the tolerated minimum and maximum value for this parameter and the number of digits for showing the number in the BREIN displays.
Please do not change the name and the number of parameters, unless you are a very experienced BREIN user and you know exactly what it means to change the name of a parameter.
Press OK to leave the dialog. This will make your changes permanent by re-writing the corresponding ini-files.
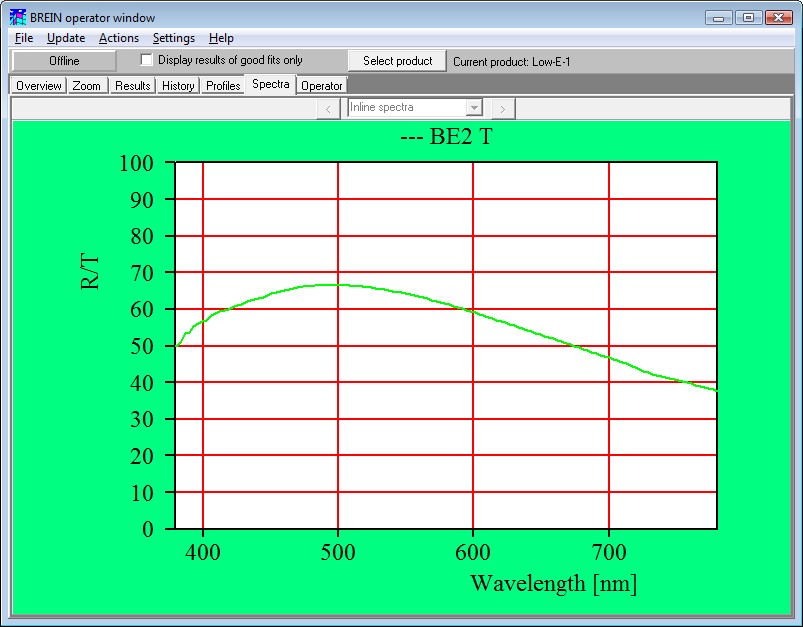
Clicking on a bright eye, you will get this:
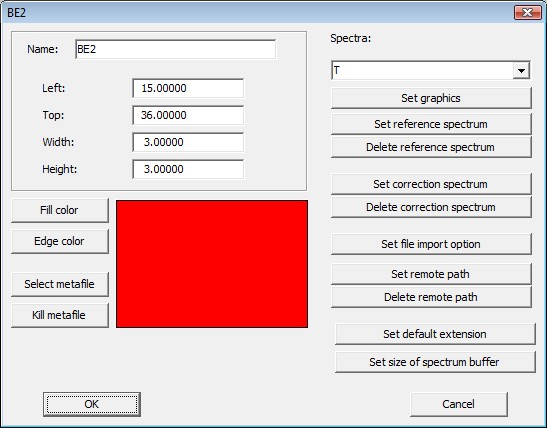
Almost all settings should never be changed after a reasonable initial setup, with a few exeptions.
Use Set graphics to change the appearance of a spectrum in BREIN displays. Please consult our Graphics course in order to select appropriate graphics parameters.
If you would like to display an ideal reference spectrum (which represents the spectrum of the ideal product at this position in the coating line) you can press the button Set reference spectrum. You will get a graph like this:
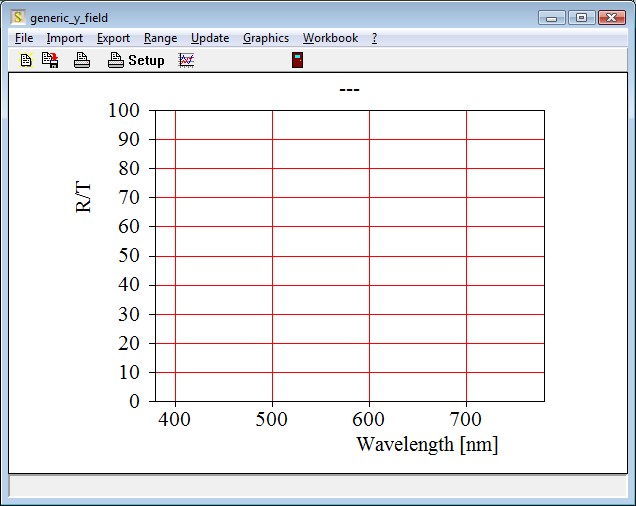
If there is a reference spectrum defined already, it will be displayed in the graph.
Use the Import command to load the wanted spectrum from a file, or from the clipboard if you have copied a spectrum to the clipboard (using our CODE software, for example).
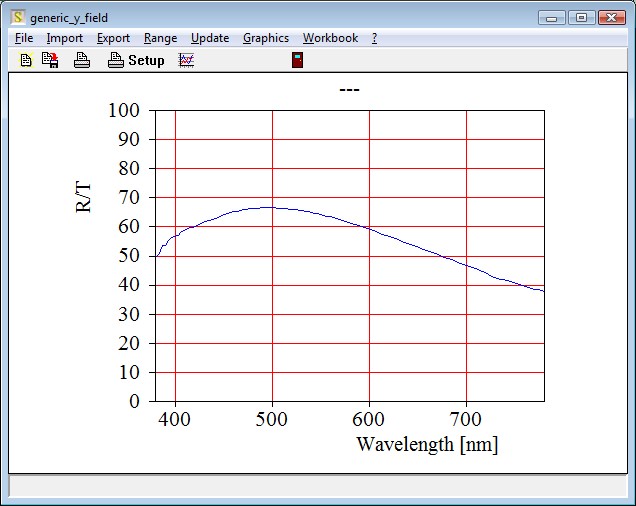
Once you have important a reference spectrum it will be displayed in the BREIN displays as a green line:
If you do not want to see the reference spectrum any more, press the button Delete reference spectrum.
The same way you can generate Correction spectra. Use the buttons Set correction spectrum and Delete correction spectrum. Incoming measured data are multiplied by the correction spectrum.
Use the button Set size of spectrum buffer to define how many spectra this bright eye station collects in a buffer. In the spectrum display you can show these spectra in order to give the operators overview over the development of the spectra in time. For inline spectra a reasonable number is 5. In the case of bright eyes which perform a line scan of the panes with several spectra, it is recommended to set the buffer size to the number of spectra recorded along the line scan.