Using only the volume fraction as adjustable geometry parameter (as in the Maxwell Garnett, Bruggeman and Looyenga models) is not enough to reproduce the measured transmission spectra of silver island films. We will now use a 'Bergman representation object' to introduce a more flexible parameterization of the spectral density that will lead to more success.
In the material list, create a new object of type 'Bergman representation'. Open the corresponding window. There are now two commands to set parameters. The menu item Parameters|Volume fraction & Percolation shows this dialog:
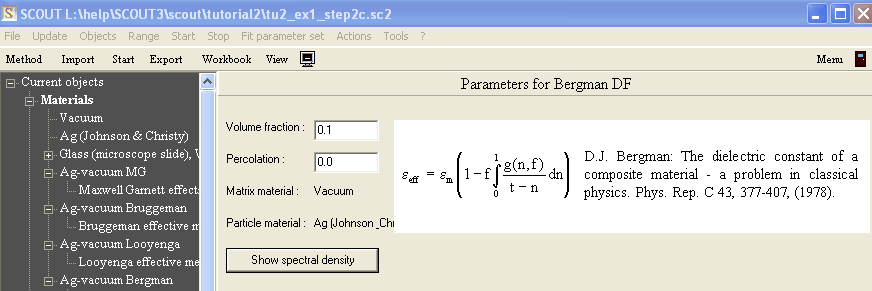
Here you can assign the materials and type in values for volume fraction and percolation strength. The dialog above already shows the settings that you should do. Since we expect unconnected silver islands the percolation strength should be set to zero.
From this dialog you can switch to a second parameter window by the Show spectral density button. Alternatively you can open this second parameter window with the Parameters|Spectral density command of the 'Ag-vacuum Bergman' object. The spectral density is set in a graphical way:
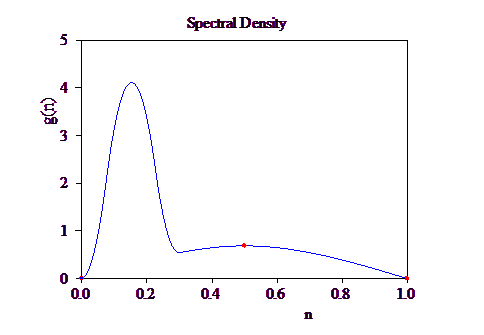
Please see the technical manual for a description of the basic features of this window, in particular you should read the section about manipulating the definition points. In the following we will practise a little the manipulation of spectral densities.
But first we have to set the spectral range and place the new effective dielectric function in the layer stack. With Update in the main window the following transmission spectrum is calculated:

Now the hard part of the story comes. We will now try - learning by doing - to understand how the choice of the spectral density's shape influences the transmission spectrum. To work conveniently we have to place the main window and the spectral density window on the screen such that we can access and watch both at the same time.
It is important that we control the shape of the spectral density by a reasonable number of definition points - enough, but not too many. In the Points submenu choose Points|Add point and add a few points along the curve of the present spectral density:

Before you do anything else, switch with Points|Move point back to the mode where you can move the definition points with the mouse. Then select Update in the main window and see what transmission spectrum you will get:
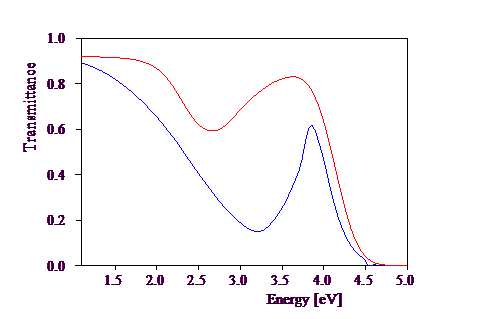
We should not forget that the layer thickness is also an adjustable parameter that we do not know beforehand. In the present situation where we have too much absorption in the effective medium layer it would be good to reduce the layer thickness. Select the film thickness as the only fit parameter and optimize it (Start in the main window):
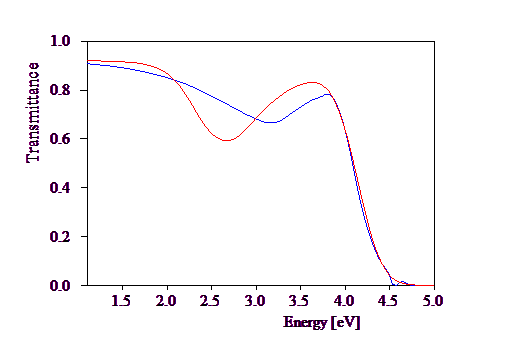
We will now try to lower the frequency position of the absorption minimum by - very carefully - moving the peak in the spectral density to the left. Try to achieve something like this:
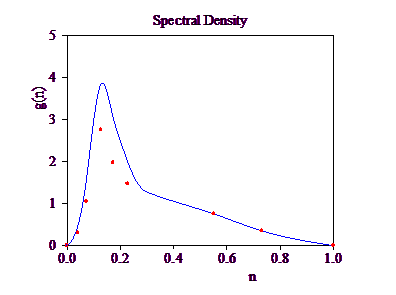
The transmittance now is the following:

The minimum has moved in the right direction but not far enough. Try a similar modification, i.e. push the spectral density peak even more to the left:

The agreement of model and measurement is quite good now, at least much better than the best result obtained with the simple one parameter formulas:
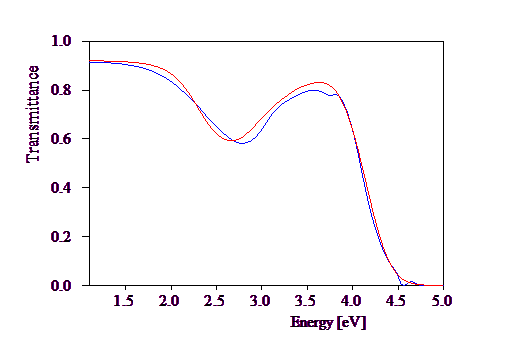
We are now in the position to try if SCOUT can do the rest automatically. Select the thickness, the volume fraction and all definition points above n=0 and below n=1 as fit parameters. Note that only the height of a definition point appears as adjustable parameter, the n-value is fixed. Before you start the fit, you should save your configuration. In case something goes wrong, you may want to load this configuration later to go back to the current starting situation.
After a while I arrived at the following status:


Although the fit looks quite good, we cannot accept it because the spectral density curve is negative between 0 and 0.05 . Such a situation may happen if you automatically fit the height of the definition points. Later and more advanced program versions in the future will probably intelligent enough to avoid this error but for now we have to correct the definition points interactively by hand.
Delete all fit parameters in the fit parameter list and add some new points in the range of n where you want to suppress negative values. Place the new points carefully: The overall shape of the spectral density seems to be good already and it would be wise to maintain most of its features.
After adding new points (i.e. changing the spectral density) Update the transmission spectrum frequently to see where you are and what you are doing. When you are confident enough you can start the next automatic fit. Select the thickness, volume fraction and the height of the definition points (skip those at n=0 and n=1) and start the automatic fit once more.
Here I leave you alone for a while and wish you good luck with the spectral density computer game. If you are desparate because by some of your actions you messed up your definition points you should probably start once more with the three default definition points. You can do so by the command Points|Delete all points. Keep on trying, keep on going! Don't forget: You are working at the frontier of effective medium theory application.
After some time I obtained a very good fit which is stored as tu2_ex1_step3.s98. The transmission spectrum is
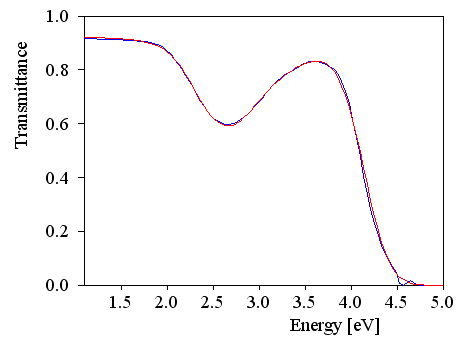
and the spectral density behaves regularly now:
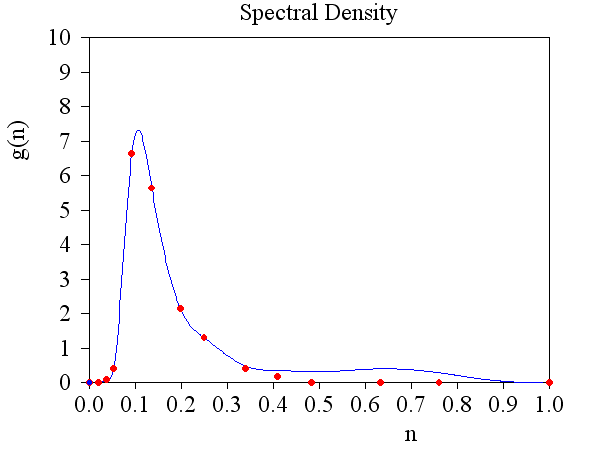
Note the simple and smooth shape of the curve. With the many parameters that we have fitted (i.e. the heights of the definition points) we have created a very simple spectral density with only one asymmetric peak. But as you have seen above, the transmission spectrum is quite sensitive to the right choice of g(n,f) - not just any peak is successful.