Settings/Color scheme |
  
|
Settings/Color scheme |
|
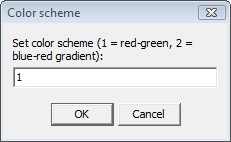
Coloring values in the Results database or on the History and Profiles pages is done using one of the following color schemes:
Color scheme |
Meaning |
|---|---|
1 |
Results within specification are drawn green, those outside tolerated limits are drawn red |
2 |
Values below the tolerated minimum are displayed in red, above the tolerated maximum in blue. Parameter values in the tolerated range are drawn in a color between red and blue, indicating the value of the parameter |