Options |
  
|
Options |
|
The menu item File/Options lets you set several options which are described below.
Submenus Difference, Weight, Target spectrum
Set the properties Show, Pen and Line mode for the subobjects Difference, Weight and target spectrum. The property Show can be checked or unchecked - if checked the data of the subobject are shown in the graphs, otherwise not. The data are shown with the selected Pen and Line mode.
Import measured data: This checked item can be used to control if this spectrum should import measured data when the global Import mechanism is used to import measurements.
Divide measued data by 100 after import: Check this menu item if you expect incoming measured data to be scaled in % while the spectrum object needs data in the range 0 ... 1. Dividing by 100 will then happen automatically after a file import or reading data from a workbook range.
Experimental data smoothing: Submenu giving access to data smoothing parameters which can be used for noisy input data. Be aware that data smoothing modifies your original data.
Validation rules for measured data: Here you can define checks of incoming measured data in order to decide if it makes sense to do a parameter fit. If one of the validation rules is violated by the measured data, the fitting routine is not performed and a rating saying 'Invalid data' is set. This will happen even if you manually try to start a fit.
A rule is defined by calling an optical function for the current spectrum and comparing its value with a number using the > or < character. Each rule must be entered as one line as shown in the dialog below:
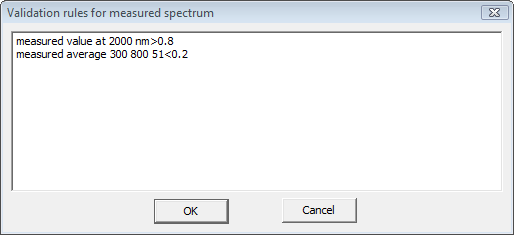
The object name must be omitted in the call of the optical function. Optical functions for spectra are described below.
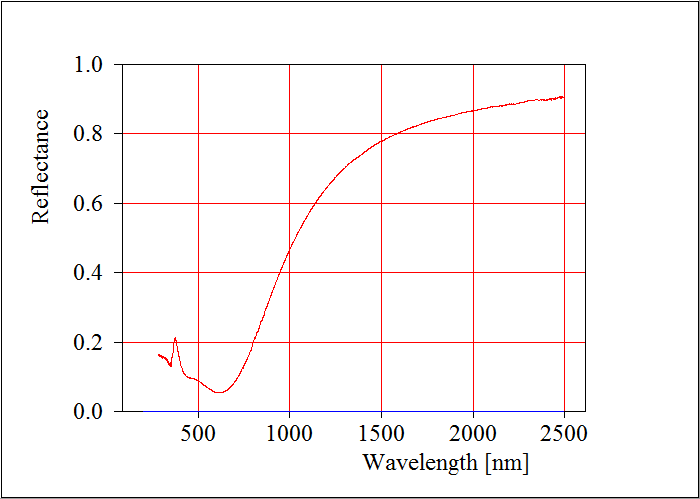
The spectrum shown below obeys the rules shown in the dialog above - a fit of these data would be possible:
Resolution: You can set a spectral resolution in order to average sharp spectral features in your simulated spectra if you have to compare them to measured data obtained with low spectral resolution. Be careful applying this feature because the way the measured data are averaged by the used spectrometer hardware might be different from the averaging method used to manipulate the simulated spectrum.
Automation: Submenu to set parameters for automatic spectrum saving in automation methods. To be used in situations where you acquire spectra at regular timer events and you want these spectra to be saved without user interaction.
Parameters for U-value computation: To be used in CODE only. U- and g-value objects can be linked to one and the same spectrum in order to synchronize their parameters (emissivity settings, for example). If you change the U-value parameters here in the spectrum, all linked U- and g-value objects will use these settings in their computation.