sample_position |
  
|
sample_position |
|
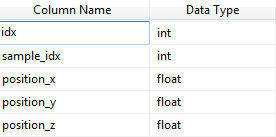
Rows in this table are used to connect measured spectra to a specific position on a sample. A measurement position is given by 3 floating point numbers which represent coordinates like x, y and z in most cases. A measured spectrum is assigned to a sample_position by specifying its index. The corresponding sample and the position on the sample can then be looked up.
Columns: