The View_RT utility |
  
|
The View_RT utility |
|
The angular and spectral dependence of the scattering probabilities can be visualized using the View_RT program which is a small utility delivered with SPRAY:

Use the Import command and select the RT data that you want to inspect. Here is an example:
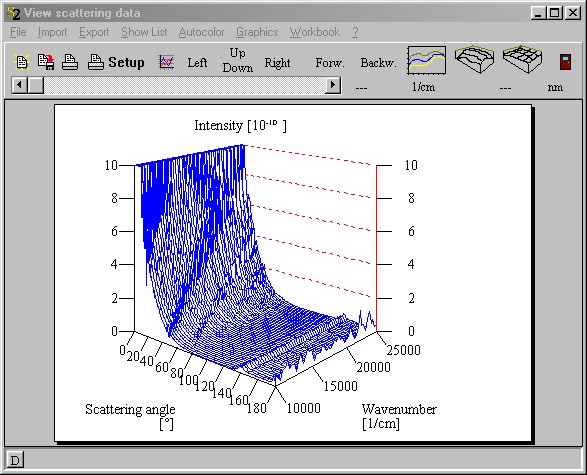
The View_RT program is very much like the Collect program. You can generate 3D and 2D views. In 2D mode you can use the slider to move through the wavenumber dependence of the scattering data. Here is a screenshot:
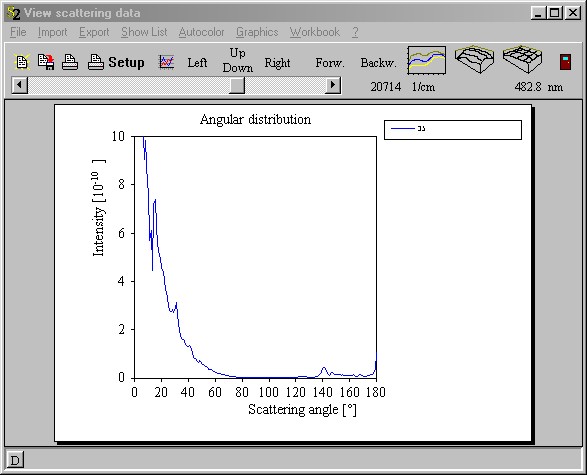
The numbers right to the wavenumber slider tell you where you are on the wavenumber and nanometer scale.