Numbers |
  
|
Numbers |
|
These objects are used to display obtained values to the operators. Besides the parameters for text displays you can define the number of decimals to be displayed by setting Digits. If the bright eye determines the parameter for various positions like a spectrometer system moving on a traverse, you can set the Position for which you want to see the parameter value. You can also display average values by specifying a position range with expressions like '800 ... 1200'. Brein uses the string '...' to identify a range definition - it the string occurs in the text the number before '...' is used as range minimum and the number to the right as range maximum.
Number objects can show parameter values in different ways. The appearance is determined by the Display mode. The following tables summarize available display modes:
Horizontal, i.e. column headers written from left to right:
Display mode |
Meaning |
|---|---|
1 |
Show the current parameter value only |
2 |
Show the current value and the target value |
3 |
Show current value, target value, and the required parameter change (in %) to reach the target |
4 |
Show the parameter name, current value, target value, and the required parameter change (in %) to reach the target |
-4 |
Show column names according for display mode 4 (this is used to generate a kind of table header in the operator view) |
5 |
Same as 4, but the 'change percentage' is shown with 1 decimal instead of no decimal at all |
6 |
Show the parameter name, current value and target value |
-6 |
Generate the header for display mode 6 |
7 |
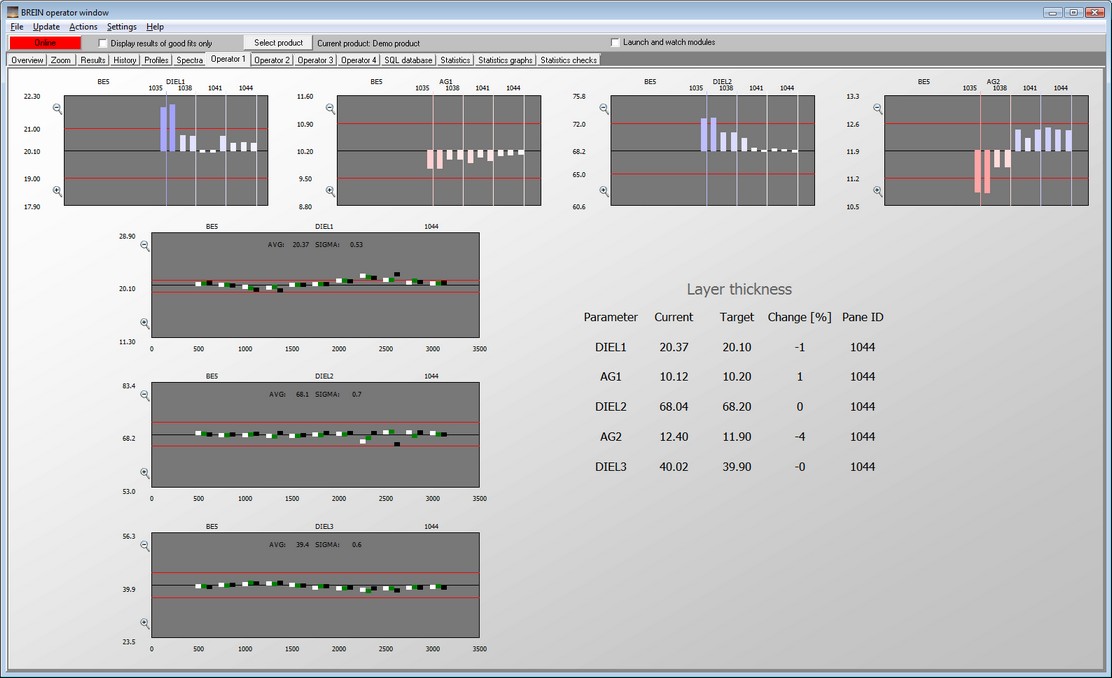
Show the parameter name, current value, target value, the required parameter change (in %) to reach the target and the pane ID |
-7 |
Generate the header for display mode 7 |
8 |
Show the parameter name and the required parameter change (in %) to reach the target |
-8 |
Generate the header for display mode 8 |
Vertical, i.e. column headers written from top to bottom:
Display mode |
Meaning |
|---|---|
103 |
Show current value, target value, and the required parameter change (in %) to reach the target |
104 |
Show the parameter name, current value, target value, and the required parameter change (in %) to reach the target |
-104 |
Show column names according for display mode 4 (this is used to generate a kind of table header in the operator view) |
105 |
Same as 4, but the 'change percentage' is shown with 1 decimal instead of no decimal at all |
106 |
Show the parameter name, current value and target value |
-106 |
Generate the header for display mode 6 |
107 |
Show the parameter name, current value, target value, the required parameter change (in %) to reach the target and the pane ID |
-107 |
Generate the header for display mode 7 |
108 |
Show the parameter name and the required parameter change (in %) to reach the target |
-108 |
Generate the header for display mode 8 |
The screenshot below gives an example where numbers with display mode 7 and -7 are shown: