Settings/Profiles |
  
|
Settings/Profiles |
|
This command opens a dialog to define the Profiles display:
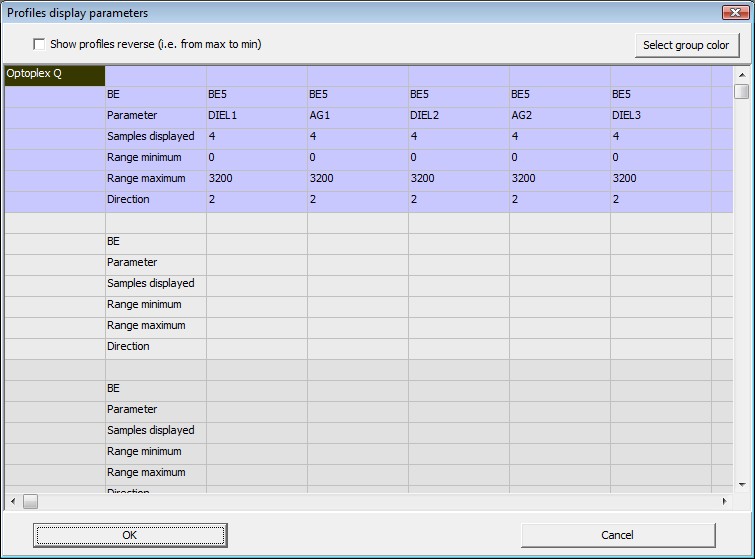
The Profiles display shows parameter values vs. position, usually thickness values measured across the panes using a scanning detection system running on a traverse.
The strategy here is similar to the one described above (History display).
In each group you have to define the bright eye (BE), the parameter name and the number of samples to be displayed (the latest sample is shown on top, while older ones are pushed down in the display as soon as new results are received). The number of samples must be the same for all parameters.
The Range minimum and Range maximum numbers define the position range, i.e. the dimension of the traverse system. The value of Direction can be 1, 2 or 3, representing the x-, y- or z-direction. In the case of traverse data, the direction parameter must be 2.
If you check the 'Show profiles reverse' checkbox the profiles will be shown reverse, i.e. the maximum value will be on the left and the minimum on the right. This setting is global - it affects all profile plots (also those in operator displays) in all products.