Settings/Statistical specifications |
  
|
Settings/Statistical specifications |
|
Use this command to set specifications for line scans which can be used to decide if a pane should be rejected or not. The dialog looks like this:
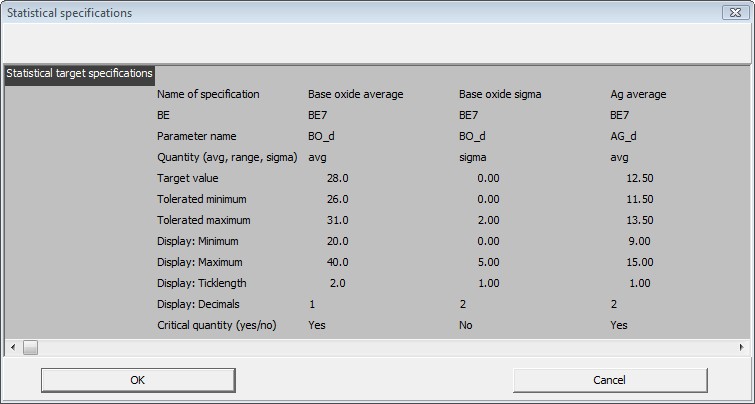
A specification must have a name which is to be used in the definition of statistics graphs (see above). You have to specify a bright eye (BE) which must be one that performs a line scan. The parameter to be statistically inspected is given by 'Parameter name'. As statistical quantity you can select 'avg', 'range' or 'sigma' which mean the average, the range (i.e. the difference of the largest and the smallest value of the scan) and the standard deviation. For each statistical quantity you can set the target value and values for the tolerated minimum and maximum. For the statistics graphs you have to specify the minimum and maximum of the display range as well as the ticklength and the decimals. Finally you have to declare a quantity as critical for rejection or not. A pane is marked as 'Bad' if at least one critical value is out of specification.
Once you close this dialog you are asked if you want to generate a new database table for the computed data:

Caution! If you answer here with 'Yes' all current data in the table are lost! You should generate a new database file only if you have changed the number and the names of the parameters.
The computed quantities are shown on the page 'Statistics checks' which might look like this:
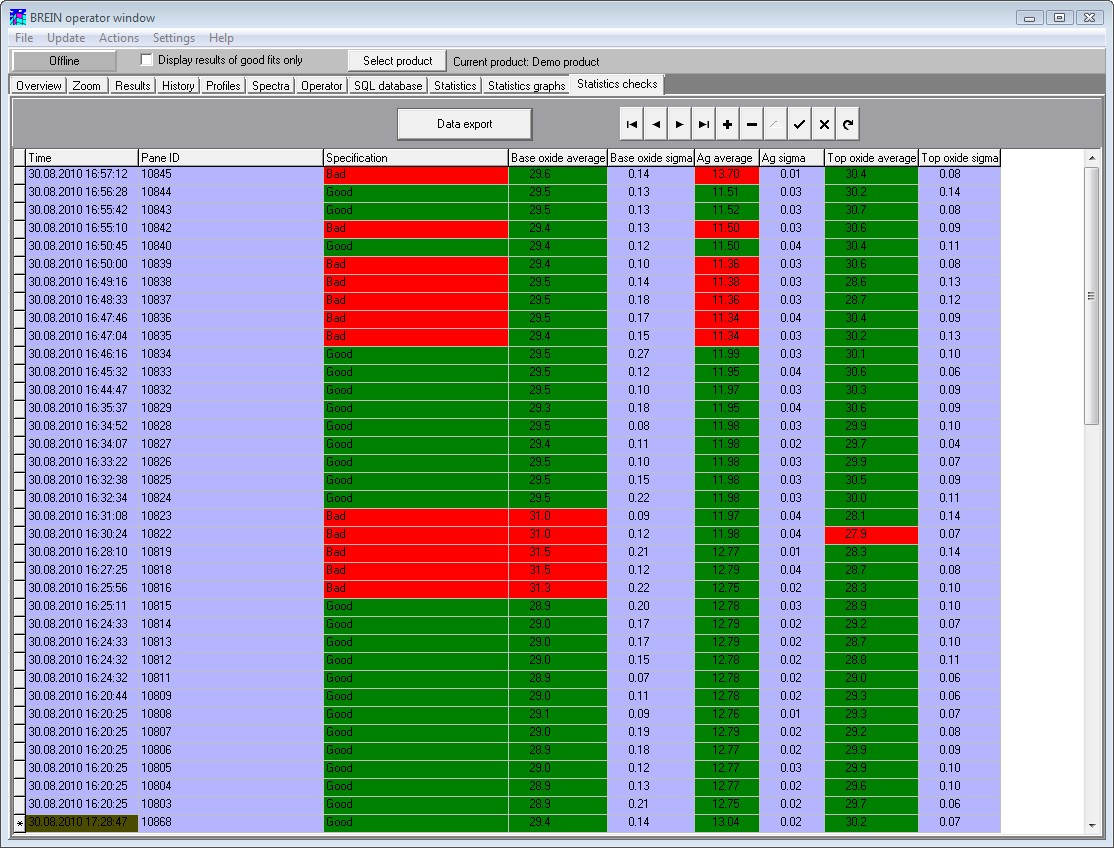
Critical quantities are shown in red or green depending on their value. The column 'Specification' is drawn green if all critical quantities are within specification and red if at least one is out of target.