Settings/Statistics graphs |
  
|
Settings/Statistics graphs |
|
If one of the bright eye stations performs linear scans of the panes (e.g. profile measurements across the width, perpendicular to the motion of the panes in the coater) you can compute and display statistical values of the parameters. Available are the average, the minimum and the maximum, the range (the difference between the maximum and the minimum value) and the standard deviation sigma. You can generate several graphs which are displayed on the page Statistics graphs.
The quantities which can be shown on the 'Statistics graphs' page are defined in the section Settings/Statistical specifications (see below).
The settings are done in the following dialog:

The shown settings define three groups of graphs showing three graphs each. For each group you can set the display type which must be either 'History', 'Profile X', 'Profile Y' or 'Profile Z'. The 'History' type shows the development of the values for a number of panes, the others show the profiles for an individual pane which were used to generate the average value.
A 'History' plot looks like this:

In the upper left corner you can click on the 'Live' button to switch from a live graph (showing the last 240 panes) to a historic plot which lets you move deeper into the past, using the buttons <<, <, >, >> in the upper right section of the window.
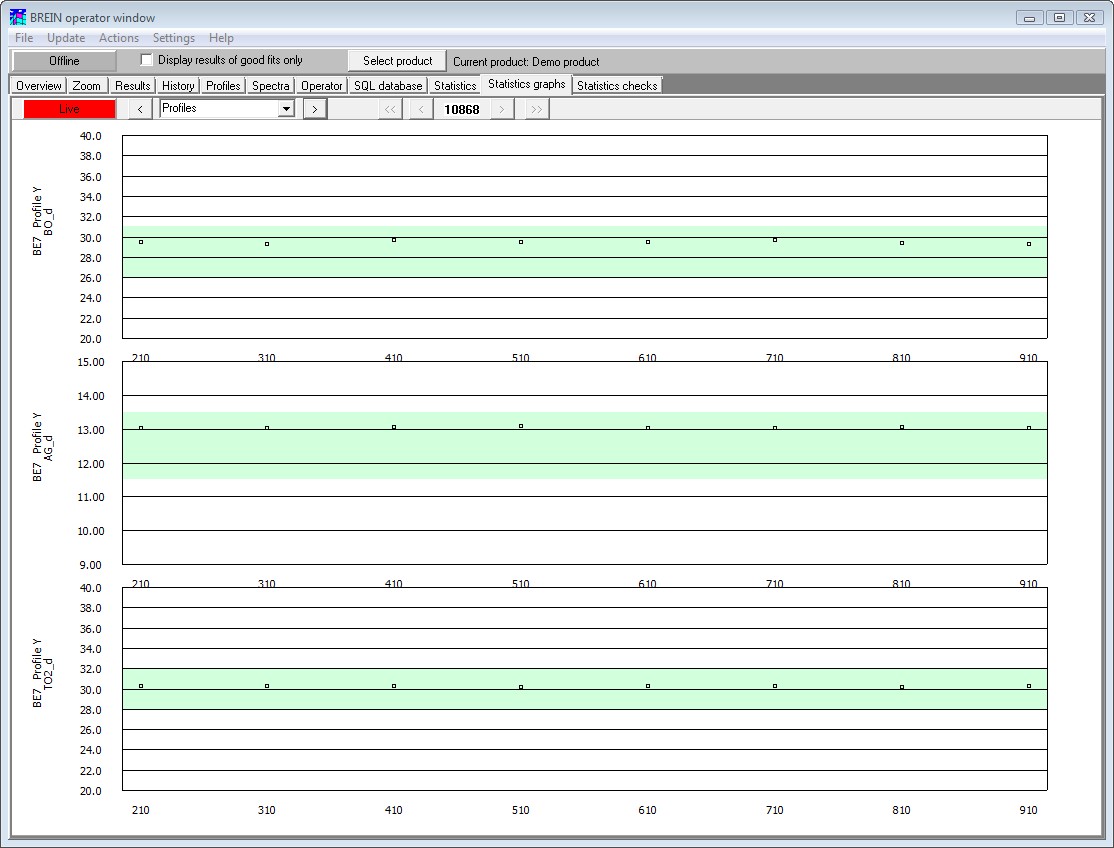
An example of a profile graph is given below: