Example |
  
|
Example |
|
Most objects generate two-dimensional graphs, i.e. they display a relation between two quantities using a horizontal and a vertical axis. In this section the control of 2D graphics is explained using as an example data generated with our tool Data Factory. The graph below shows the formula used to compute the data and a first graph in the main window of the program:
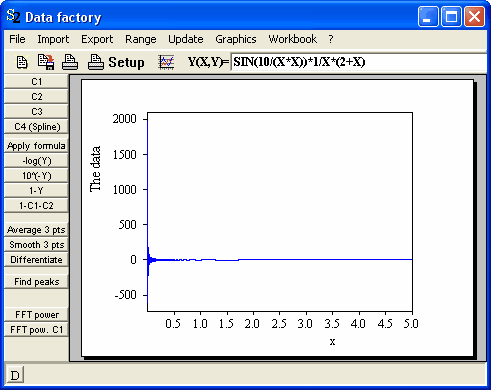
The data are computed in the range 0.001 ... 5 with 5000 data points.