Axis definition |
  
|
Axis definition |
|
The x-axis as well as the y-axis are specified by the following parameters: Title specifies the axis title, Height its height in mm on the printed page. Unit of course is the unit of whatever quantity is represented by the axis, the Unit factor is a multiplier of Minimum, Maximum and Tick spacing. It should be a (positive or negative) power of 10.
The displayed range of the axis is given by Minimum and Maximum. The distance between adjacent axis 'ticks' is determined by Tick spacing. An example: if Minimum is set to 20.0, Maximum to 200.0,Tick spacing to 20 and Unit factor to 0.02, x-values between 20 and 200 are displayed as shown on the x-axis on this plot:
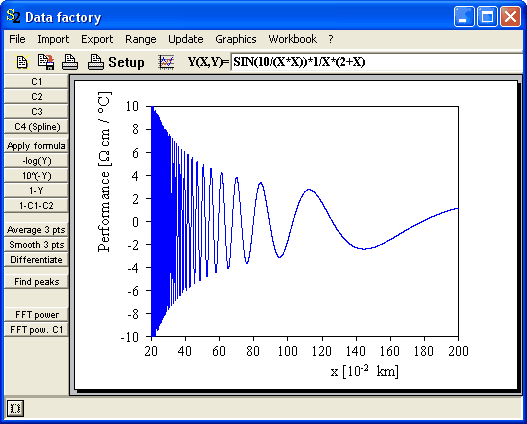
Note the negative power of ten on the x-axis and the use of units. Here is the corresponding graphics dialog with the parameters that generate the output above:
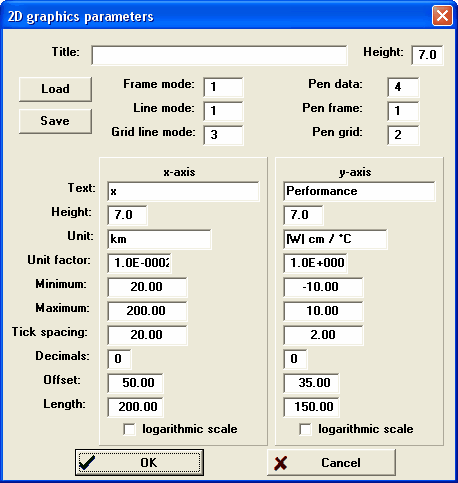
If you set Tick spacing to 0 the software tries to find a reasonable tick spacing automatically (which can be adjusted afterwards, if necessary).
Decimals means – of course – the number of digits used for axis labeling.
The position of the graph on the paper is given by Offset (distance from the lower left corner of the paper to the lower left corner of the frame of the plot, specified in mm) and Length (length of the axis in mm).
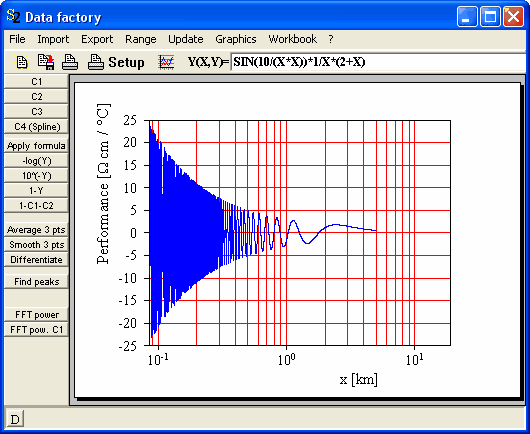
Activating the option 'logarithmic scale' switches on logarithmic scaling - be sure that the axis minimum is positive in this case. It is recommended to use frame mode 3 if you turn on logarithmic scaling: