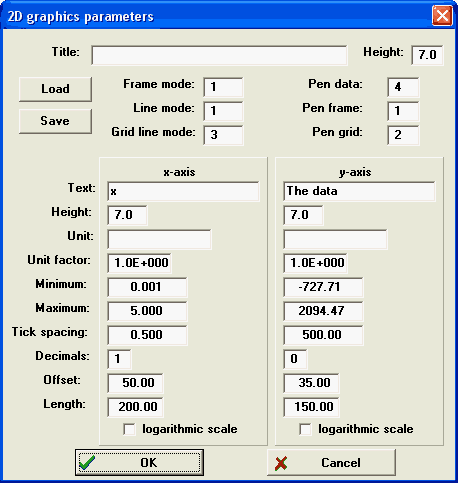
Almost all objects featuring 2D graphics offer the following dialog to set plot parameters:

The general parameters to control the design are in the top half of the dialog: the Title parameter specifies the title of the plot, i.e. text appearing as header on top of the picture. The parameter Height to the right of the title parameter defines the height of the title text in true mm. If you printout the graph without any further scaling operations all dimensions specified in mm should really appear on the paper as large as set in the dialog.
The Frame mode specifies the general style of the graph and is discussed below, also the Line mode and Grid line mode parameters which set the style of the line drawing for the 'data curve' as well as for an optional grid filling the data area (see below).
A 2D plot is done with up to three pens: one for the title and the frame (including the x- and y-axis) specified by Pen frame, one for the actual data (Pen data) and one for the optional grid (Pen grid).
In addition the settings for the appearance of the x- and y-axis (scaling and labeling) are done in the 2D plot parameter dialog as explained in more detail below.