Manipulation of the displayed graphs |
  
|
Manipulation of the displayed graphs |
|
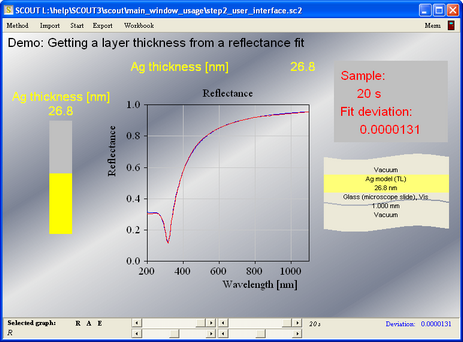
Sometimes you may want to change the pre-defined graphics settings in a view in order to inspect details of a spectrum. The statusbar provides (on the left side) some controls that you can use to do so. If the statusbar is not visible, press the key s on your keyboard to let it appear:
Graph selection
Before you use one of the controls you must make sure that the graph you want to change is selected. The name of the selected graph is indicated in the bottom left corner of the status bar. You can change the selection by a simple mouse click on the graph you want to modify.
Automatic scaling
Press the speed button labeled 'A' for automatic scaling. SCOUT will determine the required range of the x- and y-axis to display both the measurement and the simulation. If the measurement contains large fluctuations due to noise the automatic scaling may fail to give a good overview about the spectra. In this case, you have to do the settings manually or using the sliders described below.
Edit graphics parameters manually
If you want to set the displayed region manually, or change other parameters like the frame mode (to display grid lines, e.g.), apply the 'E' button which opens the graphics dialog of the graph:
See the section 'Graphics course' delivered with SCOUT for more details of graphics settings.
Changes by slider motions
The status bar has four sliders which can be used to change the displayed range of a graph conveniently. Here is how they work:
As soon as you move one of the sliders, automatic scaling is performed. The computed ranges for the x- and the y-axis are stored internally. With the two top sliders you can now set the size of the displayed range for the x- and y-axis, respectively. The left slider position means 0%, the right position 100% of the maximum range.
The two bottom sliders are used to set the position of the center of the graph (left slider: x-axis, right slider: y-axis): The left slider position sets the center of the graph to the minimum of the range found by auto-scaling, the right position corresponds to the maximum of the range.
You are encouraged to play for a while with the four sliders to get used to their function. After a short time of practise it should be clear how to move around.
Restore graphics settings
Once you have zoomed into the graph or auto-scaled the graph and you want to go back to the original display, press the 'R' button. This restores the graphics parameters that were set in the last edit operation (button 'E'). If you did not edit the parameters manually, the initial settings of the loaded SCOUT configuration are restored.