Brein.exe |
  
|
Brein.exe |
|
This is the main program that contains the visual interface to the operators. It permanently scans for new results in the relevant database folders and adds new data to the BREIN database.
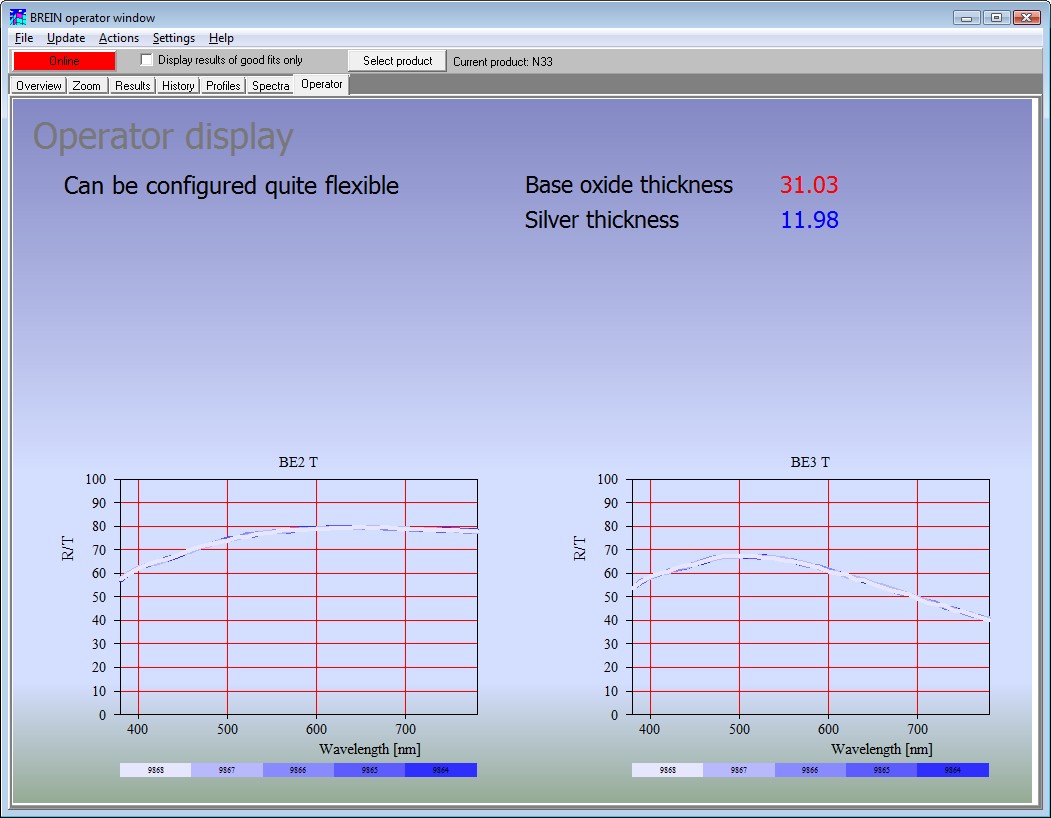
When the program starts the so-called Operator display is shown:
BREIN can be configured to be online or offline at start-up. You can switch between online and offline state clicking the button in the upper left corner of the window. The button changes its caption from online to offline (or the other way round) and its color. The colors indicating the state can be user-defined (see below).
BREIN displays
The BREIN program offers various displays for informing the operators.
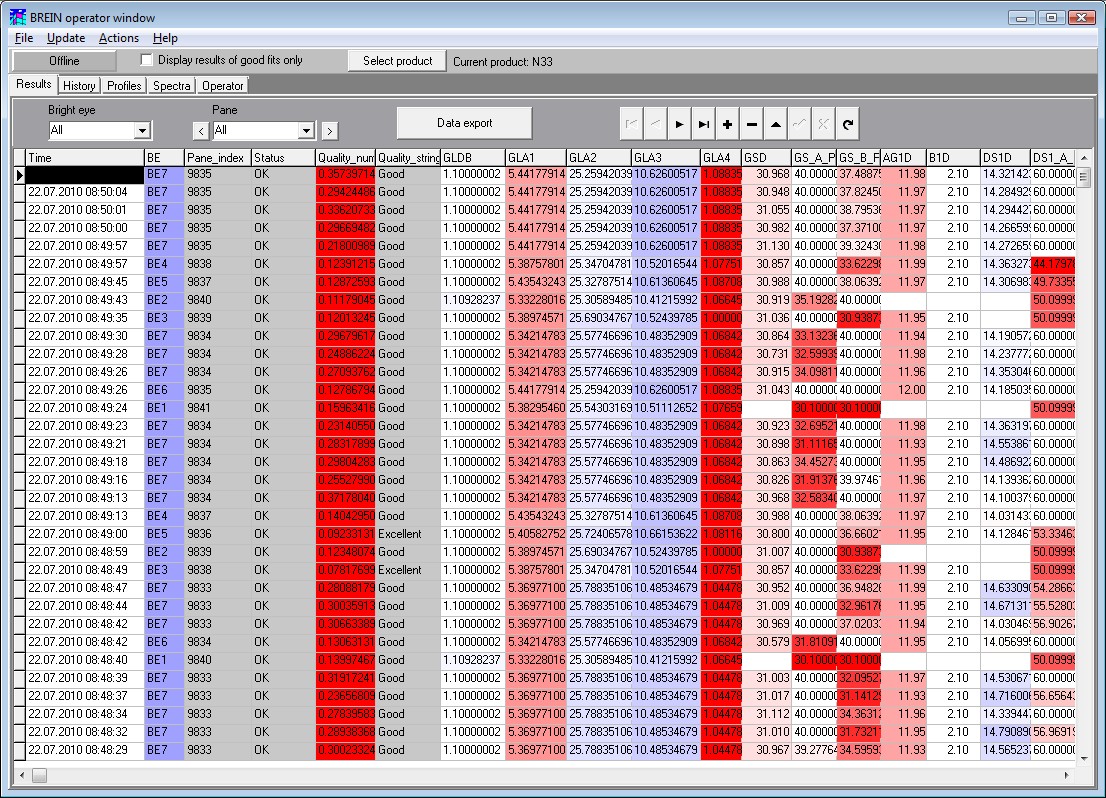
The Results tabsheet shows the content of the database as a grid of values as follows:
The most important display is called History – you can activate it by clicking on the History tabsheet:
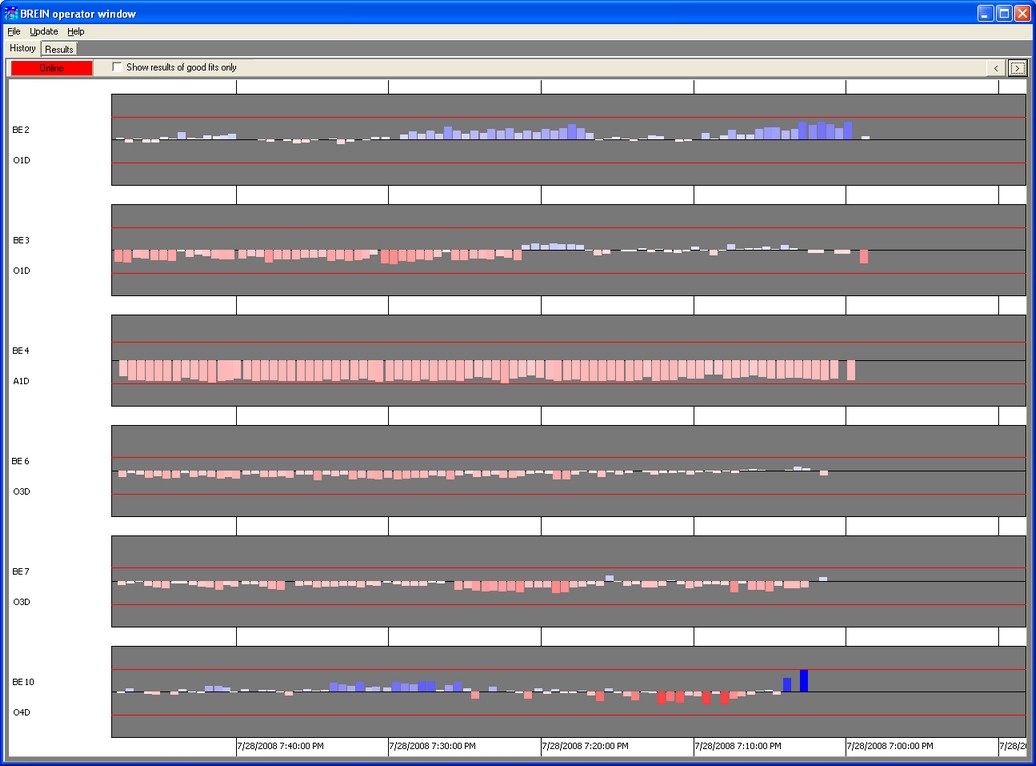
At the bottom you see a timeline that slowly moves to the right. The various vertical bars show the BREIN results. The scale of the timeline can be changed by the 2 buttons at the upper right. Clicking the > button moves the right end of the timeline more into the past, the < button does the reverse.
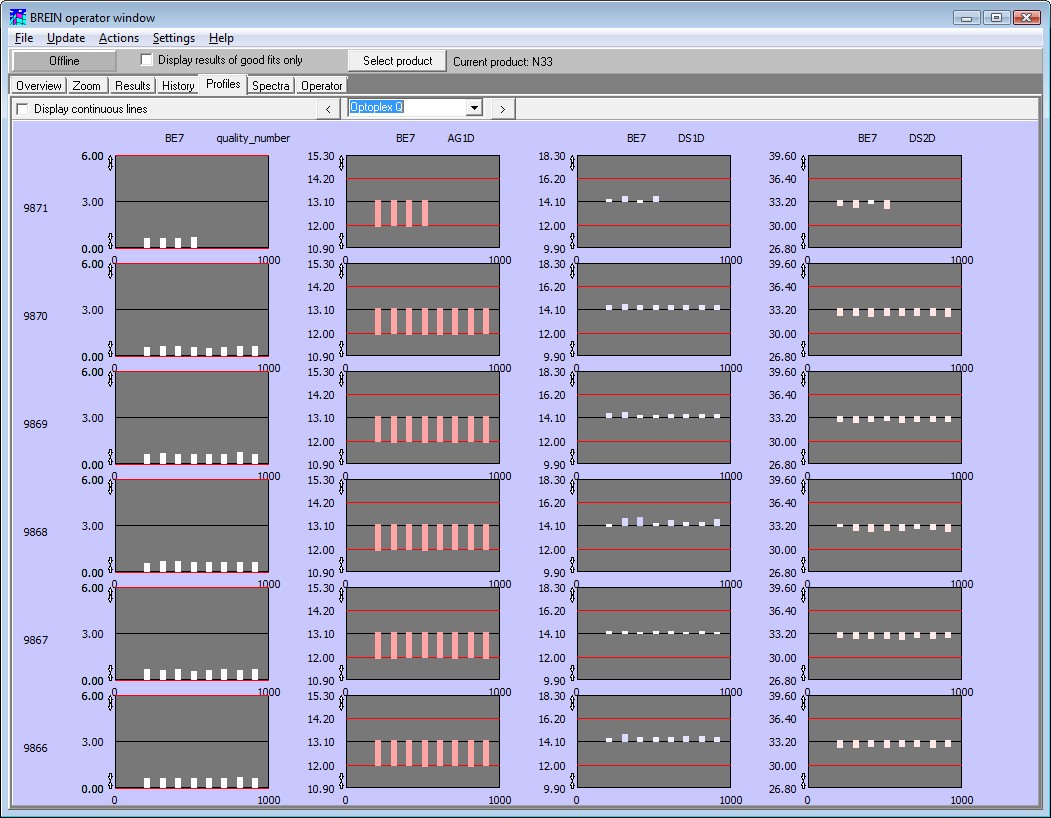
The tabsheet Profiles shows the results of the traverse analysis:
The Spectra tabsheet displays the last spectra that were recorded at the individual bright eye stations. Usually all spectra are shown simultaneously. You can inspect a single spectrum closer by pressing the Ctrl-key and clicking on a spectrum. A mouse click with the Ctrl-key pressed down brings you back to the display of all spectra.
The graphics settings for each spectrum are pre-configured. You can modify the graphics settings by a mouse click on a spectrum with the Alt-key pressed down. This opens a graphics settings dialog which allows to modify the appearance of the graph. Please see the Graphics course delivered with BREIN for the meaning of the individual items.
For each spectrum you can show a reference spectrum besides the measured data. In order to do so, you have to store the reference data in a text file (xy-format,name: reference___R.txt if R is the name of the spectrum) in the bright eye's directory. The spectral unit of the measured data and the reference spectrum must be the same.
Up to 6 operator displays can be configured in a flexible manner, showing any combination of text, parameter values, spectra and quality information.
A tabsheet called Predict can be used to visualize properties of glazing products which are built using the last produced coating.