History plots |
  
|
History plots |
|
History plots in operator views are very similar to the graphs shown on the History page: They display the evolution of a parameter vs. time. The dialog for setting the display parameters is shown below. Besides the selection of the bright eye and the parameter you have to define the time period of the display. The number is given in minutes. In the case of a scanning bright eye station you have to specify the position for which you want to see the values. If you enter a specific position (like 1000 in the example below) you have to make sure that there is a measurement at this position. If not the graph will remain empty. As shown for the parameter DIEL1 you can also specify a position range by typing in the minimum value and the maximum value, separated by the text '...'. In this case BREIN will take the average of the parameter in this position range.

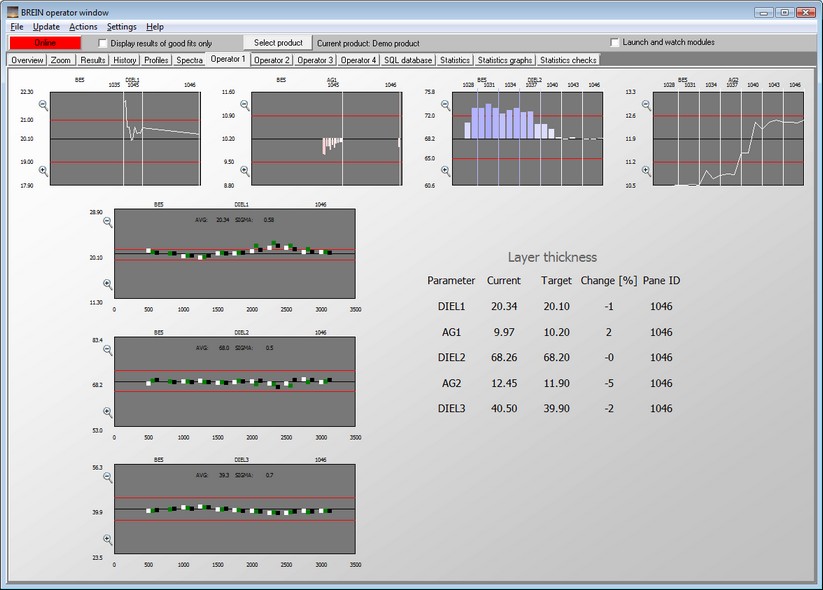
The screenshot below shows 4 different history plot objects in the top row. They use different display modes.
•Display mode 1: Bar graph with linear time axis
•Display mode -1: Line graph with linear time axis
•Display mode >10: Graphs using bars plotted next to each other, no time linearity, the number of bars to be drawn is the value of the display mode, i.e. display mode 23 shows 23 bars, display mode 15 shows 15 bars
•Display mode <-10: Line graph with equal spacing between values, no time linearity, the number of values to be drawn is the absolute value of the display mode, i.e. display mode -23 shows 23 values, display mode -15 shows 15 values