Profile plots |
  
|
Profile plots |
|
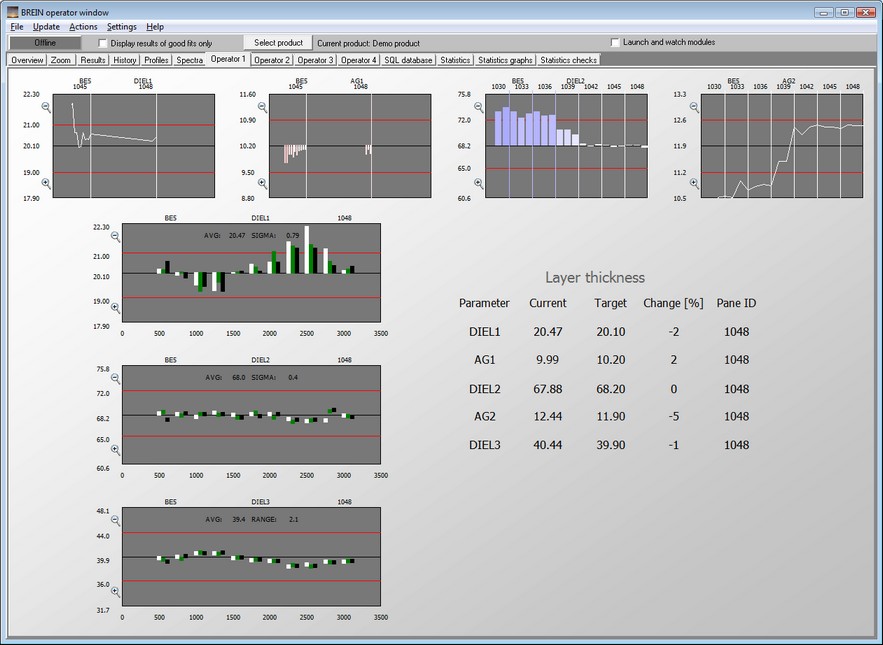
Objects of this type show parameter profile plots, i.e. graphs showing values vs. position.

Each graph will show 3 sets of data, drawn in different colors: White shows the last sample the name of which is displayed in the upper right corner of the graph. Red is the color for the previous sample, and black represents the next oldest sample. This shall put the operators in the position to view changes of the profiles in time - at least a little.
The line mode parameter controls the style of data drawing:
Line mode -1 : Bar graphs
Line mode 1: 'Dot' graphs
The display mode parameter is used to define which numbers are displayed in the upper part of the graphs:
Display mode 1: The average and the standard deviation sigma of the profile are shown
Display mode 2: The average and the parameter range (maximum value - minimum value) are shown
Display mode 3: The average and the parameter range (maximum value - minimum value, expressed in % of the average) are shown
Here is an example of profile plots (lower left side):