Step 2 |
  
|
Step 2 |
|
Now check the checkbox labeled 'Scan' to indicate that you want to use the semi-automatic scanning procedure.
Move the cursor close to the wanted curve and press the left mouse button down. Now, with the mouse kept down, move along the curve and see that some of the black points disappear. At the same time, the number of converted pixels is displayed below the Clear button.
Move the cursor several time across the curve. The main window may look like this after a while:
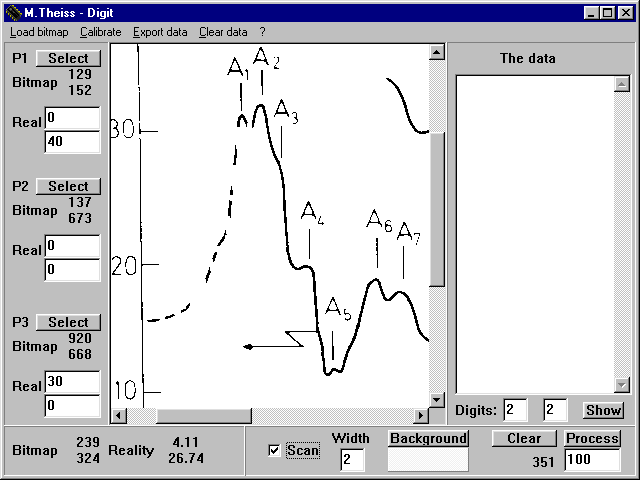
Note that there are no points in the data area yet.
What happened up to now is the following: While you move the cursor in the picture (with left mouse button pressed down) Digit tests all pixels in a rectangle around the present cursor position. The size of the rectangle is given by the number you specify below Width. The entry of 2 means that a rectangle from -2 to +2 pixels centered at the cursor position (in both the x- and y-direction) is investigated, i.e. 25 pixels are tested. If the color of a pixel differs significantly from the background color, it is taken as a data point. Its coordinates are recorded internally and its color is set to the background color. This avoids that a pixel is counted twice. In addition, you can easily see which parts of the curve have already been digitized.
The difference of two colors is measured in the three-dimensional rgb-space. If the difference vector of the red, green and blue values has a length above 100 the two pixels are considered to be different.