Program overview |
  
|
Program overview |
|
There are two ways of getting data:
1. Manual point selection
After the definition of three scaling points you simply click along the curve that you want to digitize. Every mouse click is recorded and the coordinates of the mouse cursor position are added to the list of data points.
This method is easy to learn and recommended for getting a few points in a quick manner. On the other hand, it is not very accurate and rather tedious if you want to collect many points.
Click here to learn more about this method.
2. Semi-automatic acquisition
This method is more accurate than the first one, and certainly much more elegant. On the other hand, you have to learn a little more to use it.
After the definition of three scaling points and the background color you only have to move the cursor roughly along the curve to be digitized. All pixels whose color differs significantly from the background color are identified and recorded. Based on this set of points an equidistant set of output points is constructed by suitable averaging.
Click here to learn the handling of this method.
The main window of Digit is the following:
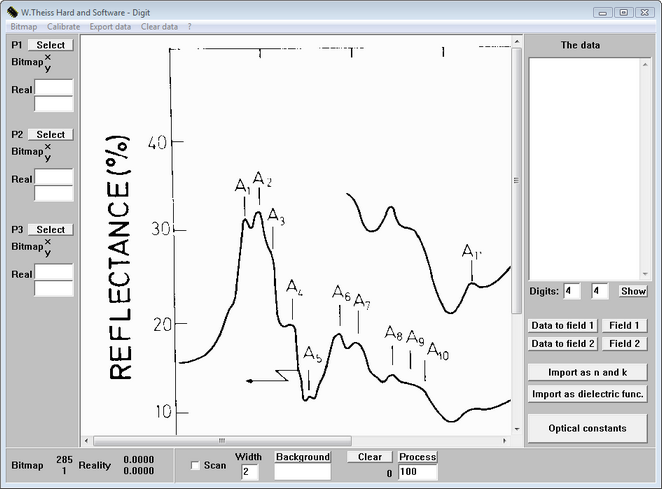
The center part of the window holds the image to be digitized. If the bitmap is larger than the space available in the window you can move the image using scrollbars.
The panel on the left side of the window holds the controls to set three definition points (P1, P2, P3). For these three points you have to enter the real word coordinates and you have to mark them on the bitmap by a mouse click. The Calibrate menu command activates the computation of the relation between pixel coordinates and real world coordinates.
After this calibration both the bitmap and the real world coordinates of the cursor position are displayed in the lower left corner of the window.
The lower right panel holds all items used for the semi-automatic scan. These will be explained later.
Finally, the right side named 'The data' is used to display the result, namely the real world coordinates of the digitized data. You get access to data fields which have methods to export the new data.