Rectangular detector |
  
|
Rectangular detector |
|
This type of detector is based on a rectangle that counts arriving rays. The dialog to set the object's geometry is this:
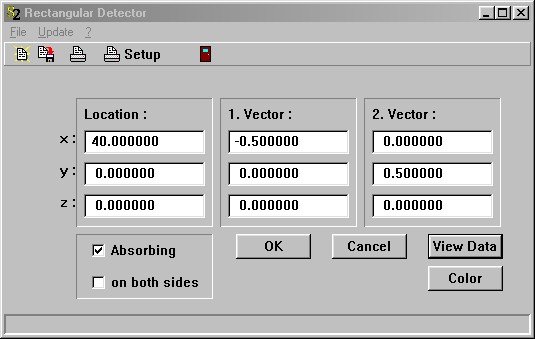
The meaning of the vector coordinates is exactly the same as for the rectangular light source discussed previously.
The option 'Absorbing' determines how incoming rays are treated: If it's checked then arriving rays are counted and absorbed, otherwise counted and transmitted without any change of direction or polarization.
If you check the option 'on both sides' the detector will count any rays that hit the rectangle. If not, only those rays arriving from the side into which the surface normal points are recorded.
The button View Data opens a window that shows the results after a SPRAY simulation:
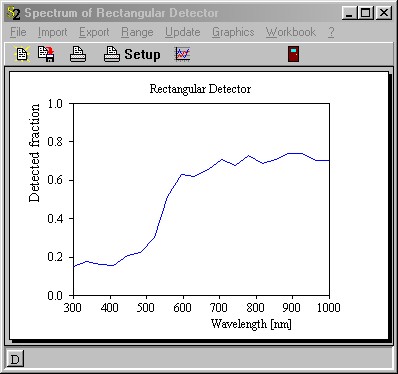
After the simulation all the detectors' spectral ranges are the same, namely the one specified for the SPRAY simulation. For each spectral point, the fraction of rays counted by the detector is computed, i.e. the ratio of the detected rays and the rays emitted by the light source. Please see the section 'How many rays do you need' for a short remark about the noise level of SPRAY spectra.
The display of the data (please consult the 'Graphics course' if you don't know how to set and modify the graph) can be printed or copied to the clipboard (as Windows metafile, a vector graphics format).
You can export the spectrum to a data file using the Export command. The SCOUT technical manual contains a description of the available file formats. The same document also shows how to write the spectrum to the Workbook which is a good way to store and compare results of various SPRAY simulations. Alternatively, you can drag&drop the spectrum to the Collect and Data Factory utilities.
If the spectral range of the SPRAY simulation covers the visible spectral range you might be interested in the color corresponding to the recorded spectrum. Pressing the Color button (see the dialog of the geometrical parameters above) opens a small window showing color information:
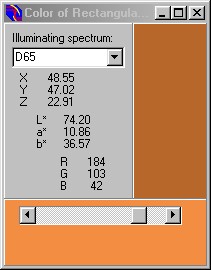
This window is exactly the same as the one used to display color information in our Coating Designer (CODE) thin film software. Please consult the CODE manual for details. The detected spectrum is treated like a reflectance or transmittance spectrum of a layer stack, and the color coordinates are computed using the selected illuminating spectrum (Here: D65). SPRAY computes and displays X,Y,Z, L*, a* and b*. The color coordinates are converted to RGB values in order to paint a rectangle (upper right section of the window). This gives only a rough, qualitative impression of the color since the conversion is done in a simple, not very accurate way. The lower section shows a rectangle with the same a* and b* values, but a user-defined L* value which you can vary by moving the slider. If the original L* value is too small the color impression on the screen may appear to be almost black, and you can use the slider to get a brighter version of the color.
Of course, you can use as many detectors as you like in a SPRAY scenery.
Access by OLE automation
OLE automation controllers can modfiy a rectangular detector named 'MyName' in the SPRAY object list by the following OLE commands:
object_parameter("MyName", "x"): read/write the x-coordinate of the position
object_parameter("MyName", "y"): read/write the y-coordinate of the position
object_parameter("MyName", "z"): read/write the z-coordinate of the position
object_parameter("MyName", "x1"): read/write the x-coordinate of vector 1
object_parameter("MyName", "y1"): read/write the y-coordinate of vector 1
object_parameter("MyName", "z1"): read/write the z-coordinate of vector 1
object_parameter("MyName", "x2"): read/write the x-coordinate of vector 2
object_parameter("MyName", "y2"): read/write the y-coordinate of vector 2
object_parameter("MyName", "z2"): read/write the z-coordinate of vector 2
object_parameter("MyName", "color_x"): read the color coordinate x
object_parameter("MyName", "color_y"): read the color coordinate y
object_parameter("MyName", "color_z"): read the color coordinate z
object_parameter("MyName", "l_star"): read the color coordinate l_star
object_parameter("MyName", "a_star"): read the color coordinate a_star
object_parameter("MyName", "b_star"): read the color coordinate b_star
object_parameter("MyName", "color_r"): read the color coordinate R
object_parameter("MyName", "color_g"): read the color coordinate G
object_parameter("MyName", "color_b"): read the color coordinate B
simple_detector_value("MyName",2200): read the detected fraction at 2200 1/cm