Screen |
  
|
Screen |
|
Screens measure and display the intensity distribution of radiation like CCD cameras. A rectangle that can be positioned anywhere in the scenery is filled with a two-dimensional array of small rectangular pixels. Each pixel counts incoming rays, independent of frequency. After a SPRAY simulation the pixel signals are displayed using gray levels to indicate the measured number of rays - this way intuitive pictures of the intensity distribution are obtained.
The geometrical settings are done in the following dialog:
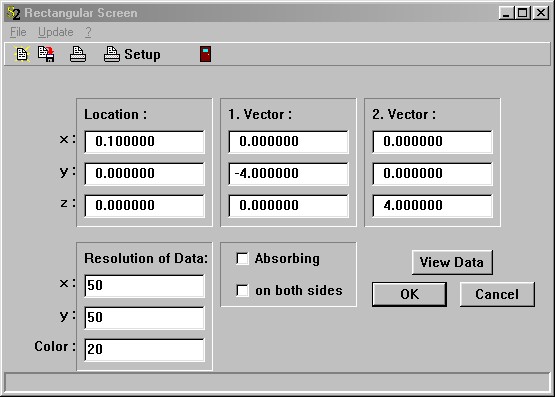
The vectors 'Location', 'Vector 1' and 'Vector 2' define the rectangle as explained for the rectangular light source. In the section 'Resolution' you can set the number of pixels to be used in the two directions: The pixels in the direction of 'Vector 1' will be drawn horizontally, those in the 'Vector 2' direction vertically. The 'Gray levels' parameter determines how many different gray levels are used for the drawing of each pixel.
If you check the 'Absorbing' item, the rays hitting the screen will be absorbed. If not, they are counted and transmitted without any modification.
If 'on both sides' is activated the rays are counted independent of their direction. If this property is turned off, only those rays are counted that approach from the side into which the surface normal points.
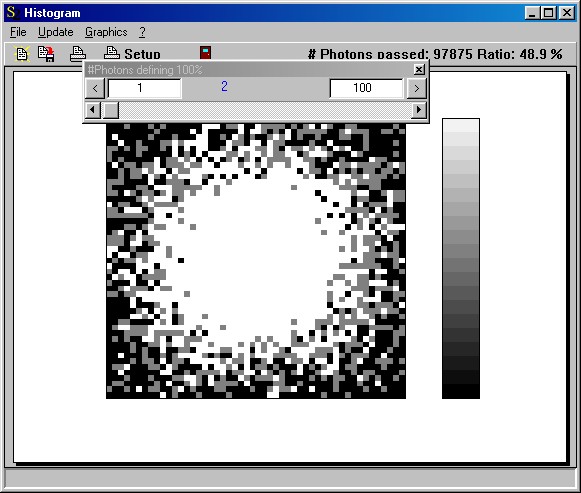
The 'View Data' button opens the graphics window displaying the intensity distribution:
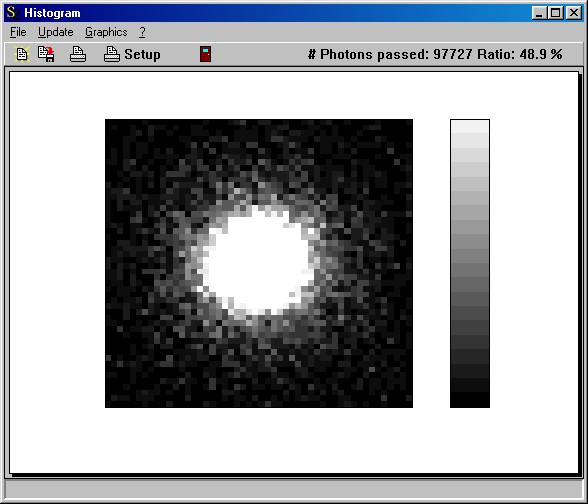
The window informs you about the number of rays that passed the screen (and the ratio of the total number of rays counted by the screen to the number of rays sent by the light source).
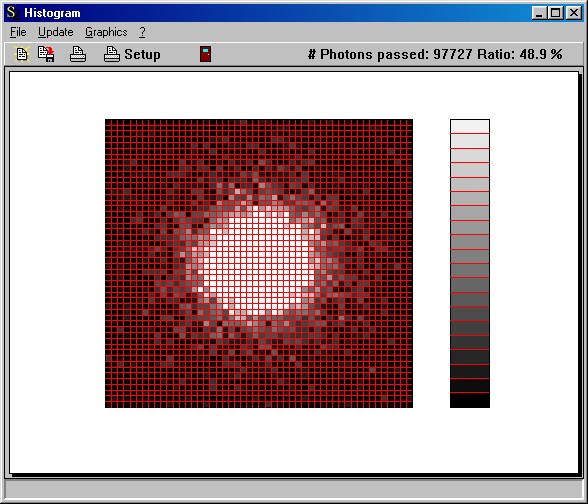
With the 'red lines' option in the Graphics menu you can turn on/off red lines separating the individual pixels:
Clicking the right mouse button somewhere in the graph opens a slider to modify the gray levels:
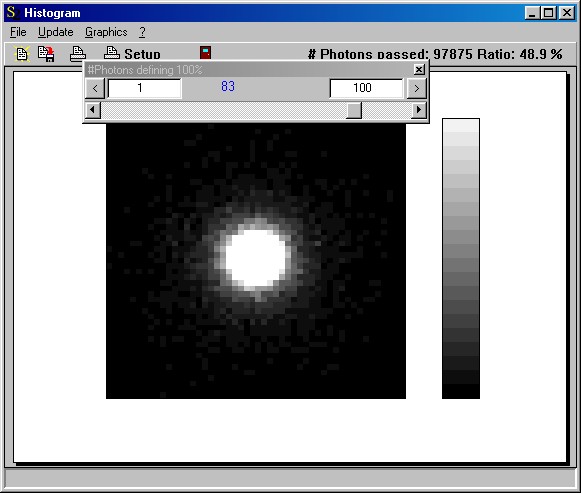
Moving the slider you can set the number of rays/pixel that is used as 100% (white color) for the picture. This way you can generate pictures with different 'brightness' to view the data at various intensity levels:
Access by OLE automation
OLE automation controllers can modfiy a screen named 'MyName' in the SPRAY object list by the following OLE commands:
object_parameter("MyName", "x"): read/write the x-coordinate of the position
object_parameter("MyName", "y"): read/write the y-coordinate of the position
object_parameter("MyName", "z"): read/write the z-coordinate of the position
object_parameter("MyName", "x1"): read/write the x-coordinate of vector 1
object_parameter("MyName", "y1"): read/write the y-coordinate of vector 1
object_parameter("MyName", "z1"): read/write the z-coordinate of vector 1
object_parameter("MyName", "x2"): read/write the x-coordinate of vector 2
object_parameter("MyName", "y2"): read/write the y-coordinate of vector 2
object_parameter("MyName", "z2"): read/write the z-coordinate of vector 2