| M.Theiss - Hard- and Software for Optical Spectroscopy | ||||
| Home | Products | Applications | Support | News |
The DIGIT program is used to digitize literature data:
Often you would like to do some calculations with data that you find displayed in scientific publications:
In the case of simple graphs you can use our Digit tool to get the data in digital form quite easily. You have to have a Windows bitmap (*.bmp) that you can create using a scanner or a video source.
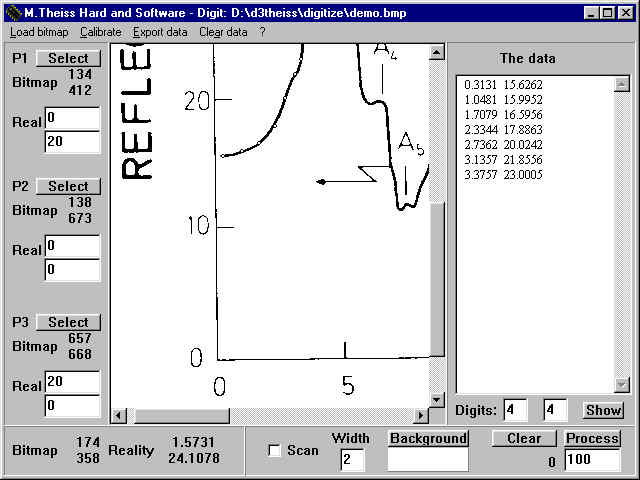
Manual point selection: After setting three reference points on the bitmap you can immediately click with the mouse on appropriate points on the curve and get the corresponding x-y-coordinates in a table that can be exported for later use in other programs.
Semi-automatic acquisition: This method is more accurate than the first one, and certainly much more elegant. On the other hand, you have to learn a little more to use it. After the definition of three scaling points and the background color you only have to move the cursor roughly along the curve to be digitized. All pixels whose color differs significantly from the background color are identified and recorded. Based on this set of points an equidistant set of output points is constructed by suitable averaging.
Registered Digit users get the program together with Data Factory and Collect. These programs can be used for further data treatment and convenient plotting after the digitizing process.
Here is a screenshot of the digitizing process:
The DIGIT program is a shareware utility that you can download and test for some weeks. If you continue to use it you should register and pay (50 USD, at present).
If you like you can inspect the online version of the Digit manual.
Responsible for this page: webmaster@mtheiss.com