Defining views |
  
|
Defining views |
|
To define the appearance of a view select it in the list of views and use the Edit command. This will open another list which contains the items that are to be displayed in the main window:
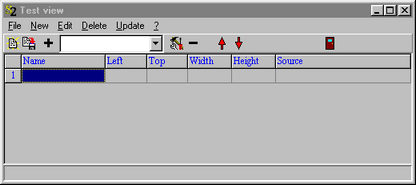
Here you can create several types of objects some of which are explained in the following. If no objects are defined SCOUT will fill the main window with a white background.
If you define more than one object to be displayed in a view note that the objects are drawn in the sequence given by the list. The object on top of the list is drawn first, then the second one and so on. This will be important for the design of a view if objects overlap.
At present the following view elements are implemented:
Rectangle Displays a rectangle with user-defined color.
Text view Displays a user-defined short text.
Bitmap view Displays a bitmap picture.
Metafile view Displays vector graphics.
Field view Displays dielectric functions, spectra or distributions.
Parameter view Displays a parameter value as text.
Parameter slider Displays and modifies a parameter value by a slider.
Horizontal bar Displays and modifies a parameter value by a horizontal bar graph.
Vertical bar Displays and modifies a parameter value by a vertical bar graph.
Workbook display (columns) Displays workbook data with one x- and multiple y-columns.
Workbook display (rows) Displays workbook data with one x- and multiple y-rows.
Sample view Displays the current sample identification.
Deviation view Displays the current fit deviation.