Basic parameters |
  
|
Basic parameters |
|
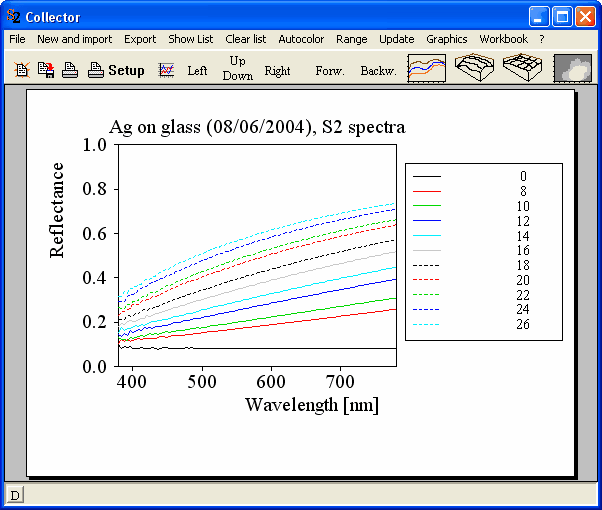
The frame mode parameter determines the general style of the graph. The same frame modes as for 2D graphs are supported here as well. In this case a 2D graph is shown using different colors and line types for the individual curves:
In addition to the 2D frame modes the following frame modes are defined:
Frame mode |
Meaning |
Button to set this frame mode |
1 |
2D graph with frame mode 1 |
|
31 |
Data grid for both x- and z-axis |
|
32 |
Data lines in x-direction, no connections in z-direction |
|
33 |
False color plot |
|
Pen data, pen axis and pen back control which pens are used for drawing the data points, the axes and the frame, and the guiding lines in the back of the frame.
The position of the graph on the paper is given by vert. offset and horiz. offset (distances from the lower left corner of the paper to the lower left corner of the frame of the plot in the vertical and horizontal direction) and its size is given by vert. size and horiz. size. As in the 2D case all these lengths must be specified in mm.