Axis parameters |
  
|
Axis parameters |
|
The axis labeling for the x-, y- and z-axis is the same in the 3D case as described for 2D plot parameters2D_plotparameter.
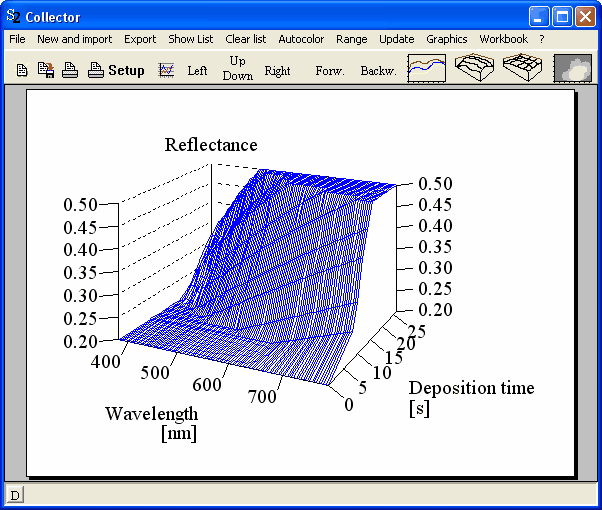
If y-values are too large or too small to fit in the 3D graph, they are set to the corresponding limits as shown in the following example:
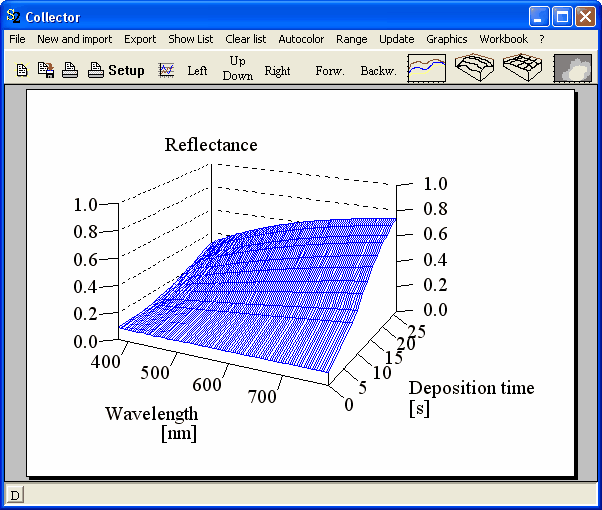
Starting with
and setting the minimum of the z-axis to 0.2 and the maximum to 0.5 one gets a picture like this: