False color plots |
  
|
False color plots |
|
In false color plots the y-values are shown as colors in a 2D graph based on the x-axis and z-axis:
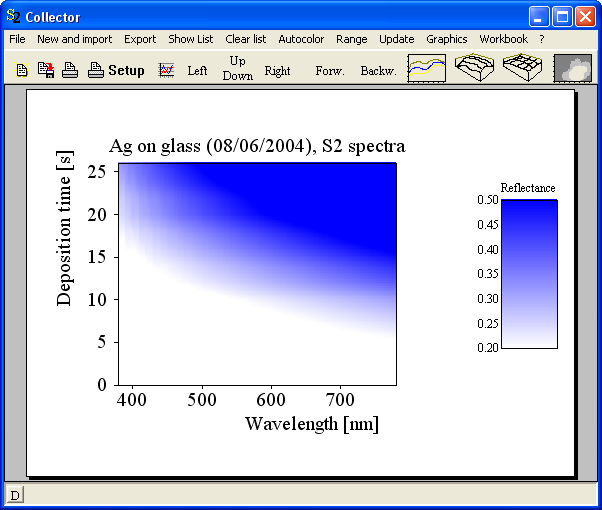
The minimum of the y-axis is displayed using the color of the 'grid pen', the maximum values have the color of the 'data pen'.