Grid |
  
|
Grid |
|
Grid objects are used to provide a colored background for other objects, and to help to align view objects.
Please note: It turned out to be useful to de-activate the mouse-driven positioning and re-sizing of grid objects since they are mostly used to provide a background for the other objects and should not be moved accidentally.
The main rectangle spanned by a grid object is subdivided into a user-defined number of rectangles. Each rectangle may have its own user-defined color. Alternatively, the colors may be computed applying user-defined functions, or by using a pre-defined color scheme. Optionally, you can show dividing lines between the rectangles.
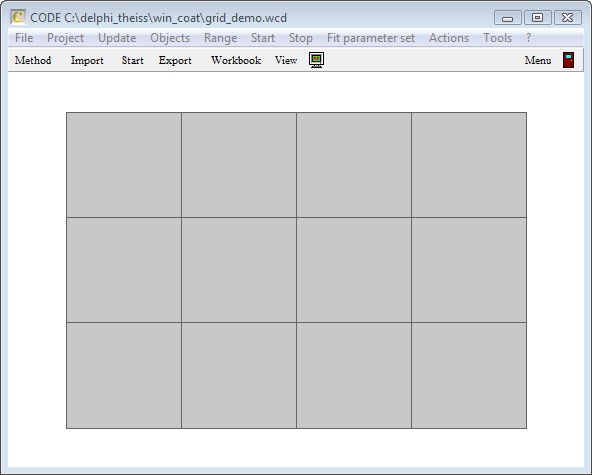
Here is an example of a simple grid object:
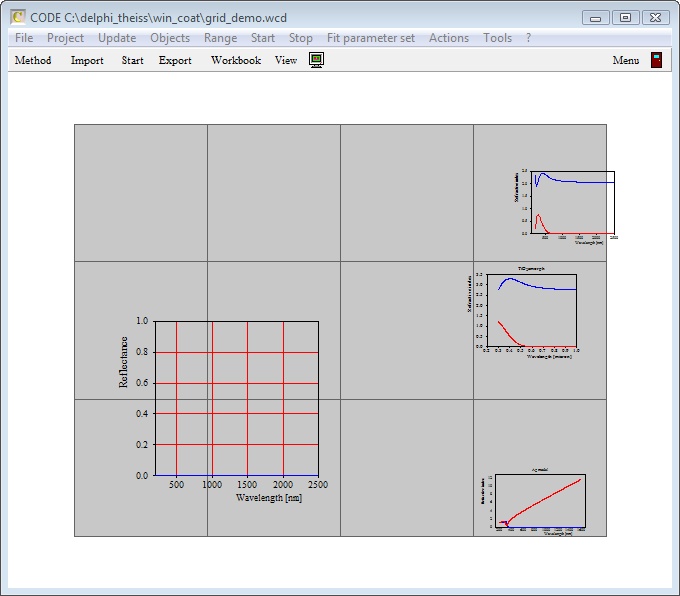
View objects in the list of view elements located underneath a grid object can be aligned on the grid. This is done by pressing the key 'g' while you are showing the main view. Each view object has a built-in function to align itself properly on a grid. This feature is usually used in the way that you only roughly position view elements on a grid (for example several field views showing various spectra) and then press 'g' to automatically align the objects on the regular grid pattern.
Here is an example. The graph below shows the situation with rough positioned elements (i.e. before you press 'g'):
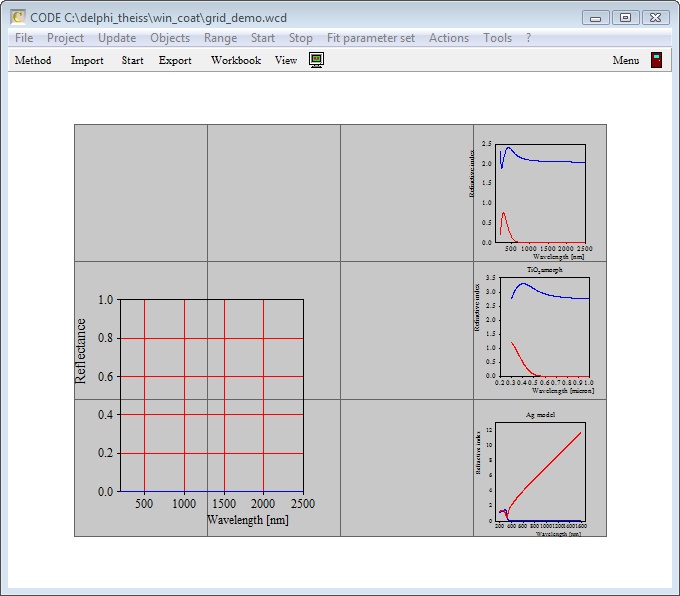
Then, after pressing 'g' to force automatic alignment, the main view looks like this:
The grid dialog
The dialog to set a grid's properties is the following:
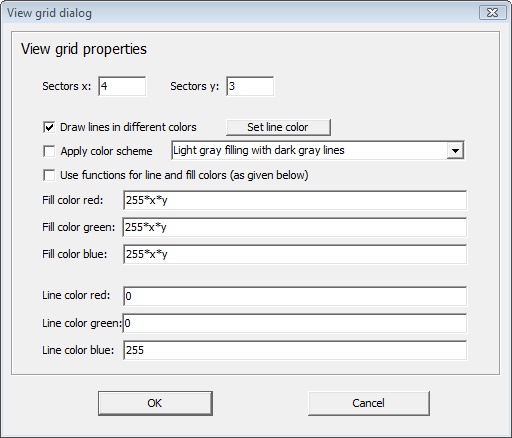
The parameters Sectors x and Sectors y are used to set the number of rectangles in the x- and y-directions, respectively.
The option Draw lines in different colors is used to activate or de-activate drawing of dividing lines. If activated, you can set the color for the lines by pressing the Set line color button. The assigned color is used unless you check the option to use user-defined functions for colors (see below).
Checking the option Apply color scheme you can select a pre-defined color scheme. This way you can easily select one of several pre-defined designs.
Finally, checking the option Use functions for line and fill colors gives you the opportunity to define your own functions for the line and filling colors. For the red, green and blue color component individual functions can be assigned which can make use of the symbols x and y for the x and y position of the individual rectangle. x ranges from 0 (left end of the grid area) to 1 (right end of the grid area). y ranges from 0 (top) to 1 (bottom). Take into account that the RGB color system uses integer values between 0 and 255 for each color component. The rounding to integers is done automatically for the user-defined functions.
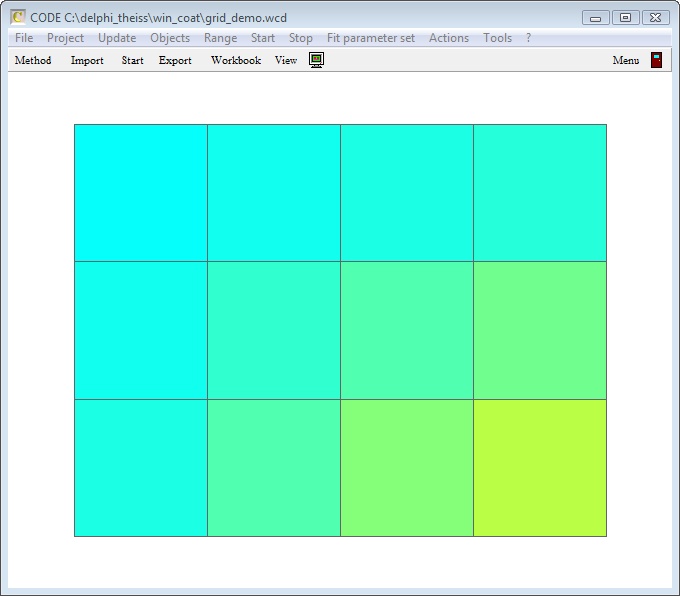
Here is an example. The dialog settings
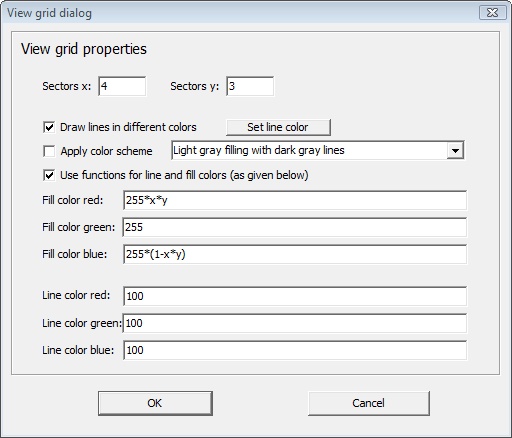
will generate this view:
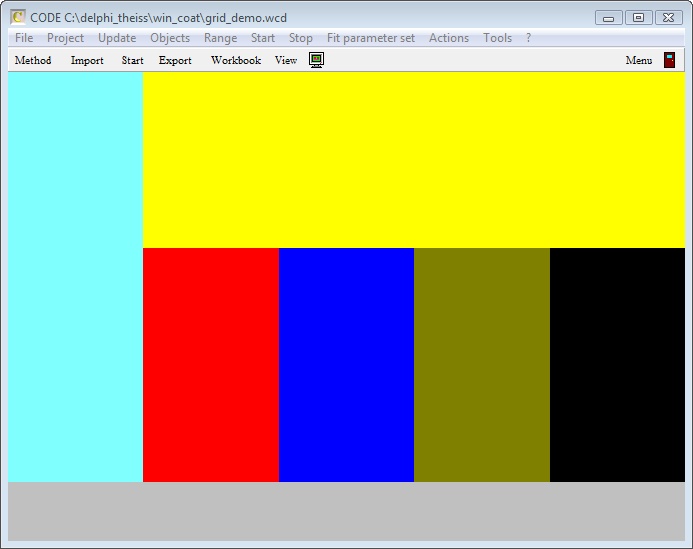
Assigning individual color to grid rectangles
In order to assign individual colors to grid rectangles you have to de-activate using a color scheme or user-defined functions. Once this is done, you can click a rectangle while holding the Alt key down. This will bring up a color dialog to set the rectangle's color. The graph below shows an example of a color assignment done this way:
Using grid objects to generate a colored background
You can use grid objects to generate advanced color gradient backgrounds. In this case you have to use a large number of rectangles. Be aware, however, that the drawing time for the background should not get too large - the background is drawn again with every update of the view. Below some examples are shown where the functions for red, green and blue and the result are given.
Deep sea
red = 0
green = 0
blue = 200*(x-1)*(y-1)

Space
red = 155*exp(-((y-0.9)/0.2)^2)*exp(-((x-0.5)/0.4)^2)+155*exp(-((y-0.3)/0.1)^2)*exp(-((x-0.9)/0.06)^2
green = 155*exp(-((y-0.9)/0.2)^2)*exp(-((x-0.5)/0.4)^2)+155*exp(-((y-0.3)/0.1)^2)*exp(-((x-0.9)/0.06)^2)
blue = 255*exp(-((y-0.9)/0.2)^2)*exp(-((x-0.5)/0.4)^2)

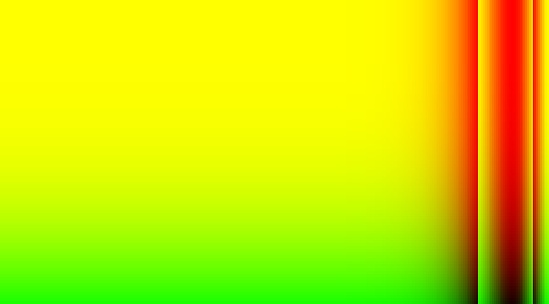
Columns
red = 255*cos(((y/1.4)/1.8)^2*3*pi)
green = 255*cos(((x)/1)^10*2*pi)
blue = 0
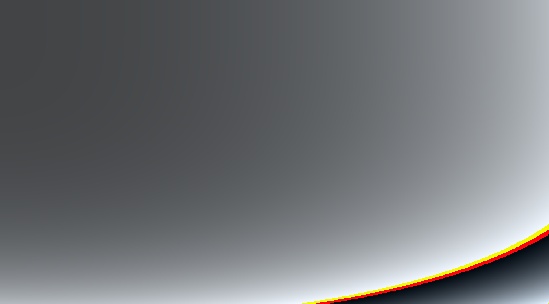
German edge
red = 66*exp(y^4+x^2)
green = 66*exp(y^4+x^2)
blue = 66*exp(y^4+x^2)
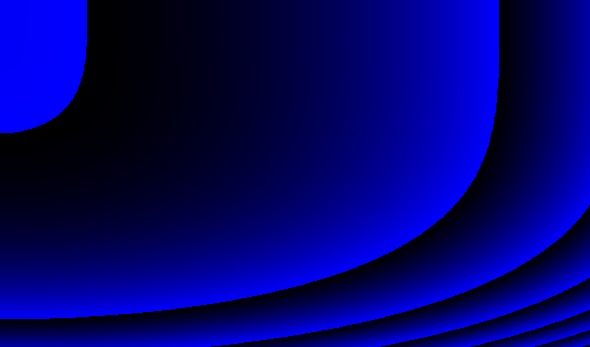
Blue
red = 0
green = 0
blue = 250*exp(y^4+x^2)
Phantasy
As you can see in the last examples, you can develop very different color gradients if you are inventive enough to generate user-defined functions. If you get the fever you should try new functions with a moderate number of rectangles. Using many rectangles means to wait a long time for the image to appear. Once you have a promising candidate you can increase the number to avoid pixel effects. However, once you compute more than 10000 rectangles the images might be nice but tedious to draw. In this case you can proceed like this: Compute the image with a large number of rectangles and then use the command Actions/copy bitmap to copy the image a bitmap to the clipboard - or use Actions/Save bitmap to store the image as bitmap file.
Finally you can delete the grid component and use a Bitmap view object to display the image as background for your view.
Here are some phantasy grid images:
Space highway
red = 200*log(((x-px)^2+(y-py)^5)/(x-px))+(x-px)
green = 150*log(((x-px)^2+(y-py)^5)/(x-px))+(x-px)
blue = 100*log(((x-px)^2+(y-py)^5)/(x-px))+(x-px)
with px = -0.01 and py = 1 (defined as master parameters).
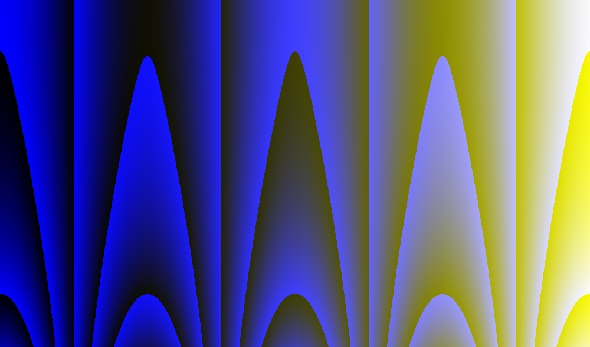
Blue yellow fountain
red = 250*x^2
green = 250*x^2
blue = 250*cos((x)*pi*4)*exp(y^2)
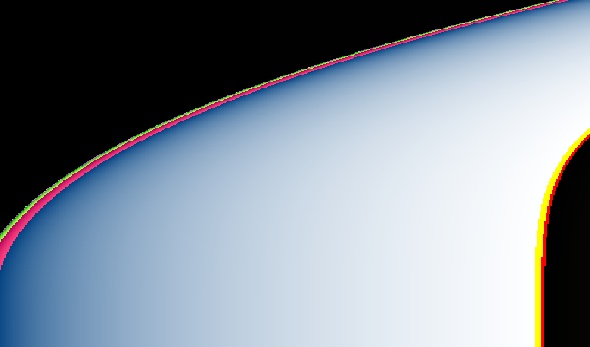
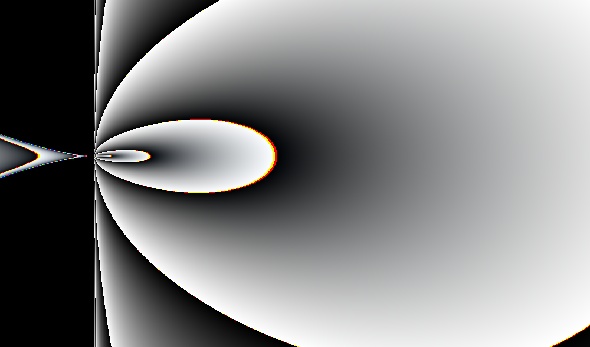
Flame3
red = 250*log(((x-px)^3.02+(y-py)^2)/(x-px))+(x-px)
green = 250*log(((x-px)^3+(y-py)^2)/(x-px))+(x-px)
blue = 250*log(((x-px)^2.98+(y-py)^2)/(x-px))+(x-px)
with px = 0.16 and px = 0.45 (master parameters).
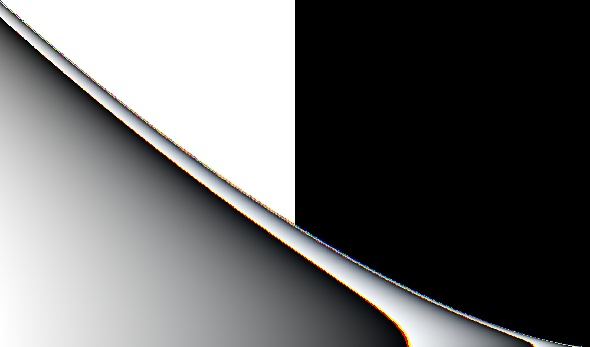
Diagonal ...
red = 250*log(((x-1)^3.02+(y-1)^2)/(x-1))+(x-1)
green = 250*log(((x-1)^3+(y-1)^2)/(x-1))+(x-1)
blue = 250*log(((x-1)^2.98+(y-1)^2)/(x-1))+(x-1)