Field view |
  
|
Field view |
|
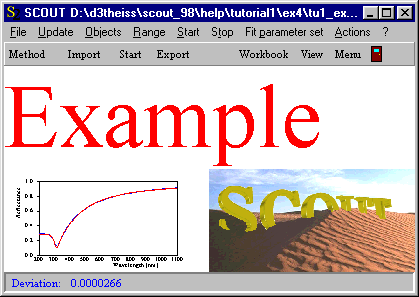
Field view objects display SCOUT spectra, dielectric functions or distributions as well as average spectra of colorbox objects. The graph is drawn within a rectangle defined by the Left, Top, Width and Height parameters. The data to be displayed have to be defined by Drag&Drop: To display a spectrum you have to open the list of spectra (from the main window: Objects|Spectra) and start in the row of the desired spectrum a drag operation. The dragging has to end with a drop above the row of the field view object in the view definition list. The example

creates the following view in the main window:
During a parameter fit SCOUT updates the view in the main window if an improvement has been achieved.
Besides spectra from the spectra list you can also drag dielectric function objects from the list of dielectric functions to a field view object if you want to display optical constants in a view.