|
| M.Theiss - Hard- and Software for Optical Spectroscopy | ||||
| Home | Products | Applications | Support | News |
Photoresist layers on silicon wafers
The analysis of infrared absorption bands in thin films which are mixed with interference patterns nicely demonstrates the advantage of using the simulation approach. All the experimentally observed structures (reflectance spectrum, red curve in the left graph shown below) are perfectly reproduced by the model (the blue curve) without any baseline correction or other manipulation of the measured data. Note that one gets from a quantitative fit like the one shown below the thickness as well as the complex refractive index simultaneously. This is because not only the periodicity but also the amplitude of the interference patterns are used. The thickness of the photoresist layer in this case is 1.29 mm. The obtained complex dielectric function (the square of the refractive index) featuring the vibrational modes of the photoresist is shown below in the right graph..
|
Now some results are shown that have been obtained in annealing experiments. The time dependence of the infrared reflectance spectra has been analyzed in an automated batch fit routine. A typical series is shown below.
 |
For various postbake temperatures the shrinkage of the photoresist nicely is demonstrated by its thickness evolution shown in the graph below.
|
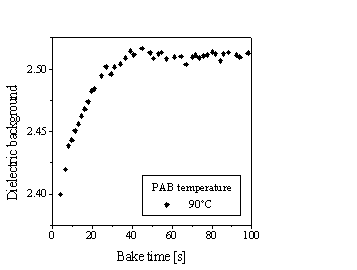
The layers obviously become more compact during the postbake which is also reflected by an increase of the real part of the dielectric function at high wavenumbers as shown below. The square root of this is roughly the refractive index of the photoresist.
 |
The analysis of the vibrational modes leads to an understanding of what happens chemically during the postbake step. As an example the evolution of the squared oscillator strength (which is a fit parameter of the photoresist dielectric function model) of one of the modes (carbonyl) is shown below. This quantity is proportional to the concentration of the oscillators which clearly are diminished during the process.
 |
Note the huge number of spectra that have been analyzed, and the very high quality of the simulation.
Responsible for this page: webmaster@mtheiss.com