3D graphics Introduction |
  
|
3D graphics Introduction |
|
Some applications like the Collector or View_RT tools display several 2D data sets in 2D or 3D graphs. Each data set must have a characterizing parameter which is used to display the set in the 3rd dimension. Here is an example of a tyical Collector configuration:
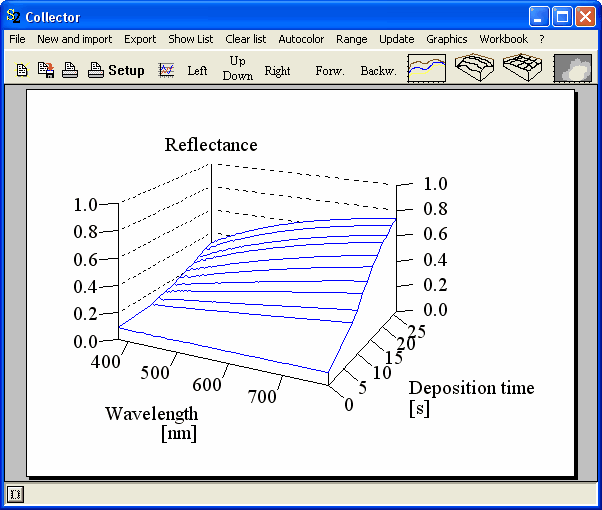
This sections describes how to use 3D plot parameters under the assumption that you are familiar by now with 2D plots as discussed above.
A graph like the one above is handled like a set of 2D curves. The x-axis is the one on the front (the wavelength axis in this example), the y-axis is the vertical 'Reflectance' axis. The new z-dimension - new with respect to 2D graphs as discussed above -is the axis on the right side ('Deposition time'). The z-values of the various data sets may be non-equidistant.
Keyboard commands
The keyboard commands are the same as for 2D graphs (see above) - consequently they act on the x- and y-axis.
Mouse commands
Up to now mouse commands are not supported in 3D graphics.