Generating the user interface |
  
|
Generating the user interface |
|
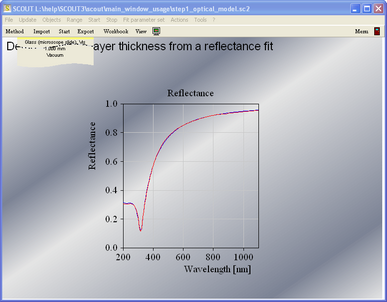
We will now configure a simple user-interface in the main view of SCOUT which will show the reflectance spectrum, the layer stack, the value of the silver thickness and some information on the fit quality. There will also be a slider for manual thickness variation. For all these things we will generate view elements which are able to draw the wanted items in the main view.
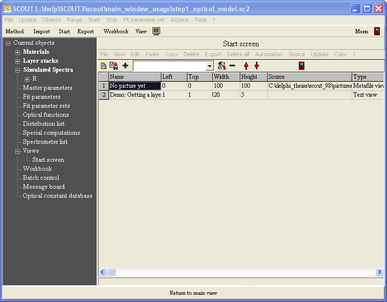
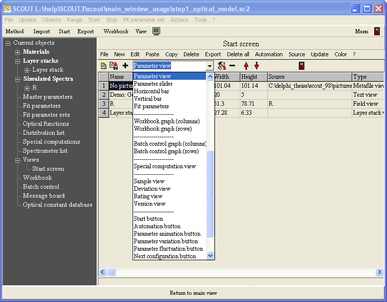
Let's start with the display of the reflectance spectrum. Open the treeview branch Simulated spectra. In addition, open the treeview branch Views and there the subbranch Start screen. SCOUT should look like this now:
A view element that displays the reflectance spectrum can be generated by a drag&drop operation from the treeview to the list of view elements on the right. Start to drag the treeview item 'R' and drop it in the list to the right:
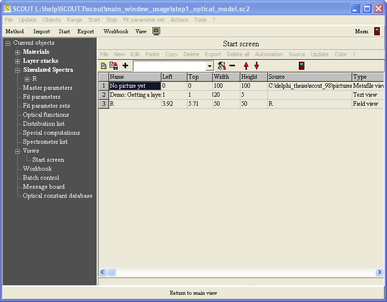
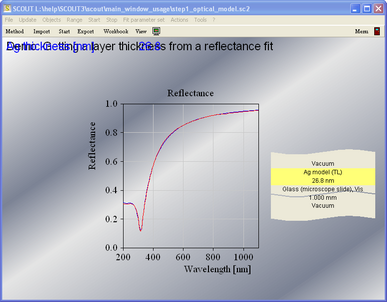
Press F7 to see the new view element in the main view:
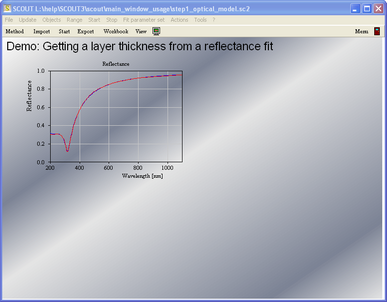
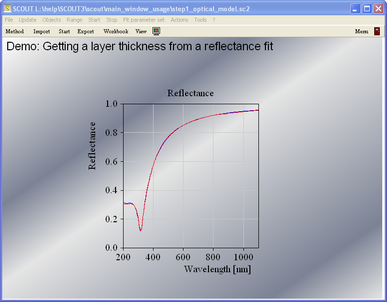
View elements can be moved within the main view with the mouse while the Shift key is pressed down. Try to move the reflectance spectum to the center of the window. Holding both the Shift and the Alt key simultaneously down, you can move the left, top, bottom or right side of the rectangle individually by mouse drags. This is a very convenient re-size mechanism. Try to position the spectrum like in the following example:
The manipulation of view elements is explained more detailed in the introduction to views.
A view element to display the layer stack can be generated the same as shown for the spectrum. Simply drag the layer stack item from the treeview to the view element list:

The result is shown below:
Layer stack view elements can be moved with the mouse using the bottom halfspace as 'mouse sensitive area' (click here for details). Drag the layer stack item to the right as shown here:

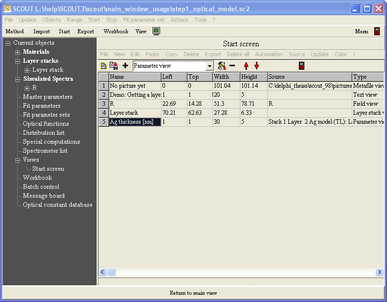
Now a view element is created which shows the current value of a model parameter. In the list of view elements, select the new object type 'Parameter view' in the dropdown box:
Then press + in order to create a new object of this type. You will get the following dialog for parameter selection. Mark the silver thickness as indicated:
Then press OK. The new view element is created with the name 'No assignment yet'. Click on the name and overwrite it with 'Ag thickness [nm]' - then press Return:
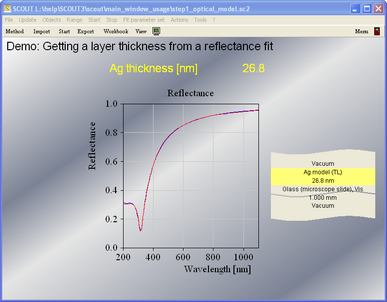
Pressing F7 shows that 2 view elements are in conflict with each other:
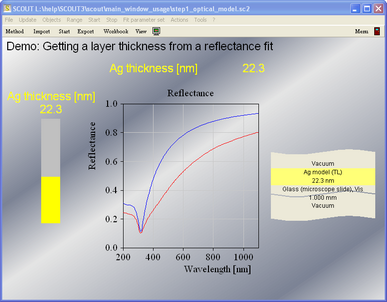
Move the blue parameter view element from the upper left corner down as shown above. Note that text is moved with the mouse using the lower left corner. Pressing the Ctrl-key and clicking on a view element raises the Edit action of the element. In case of the parameter view element a color selection dialog is shown. Use this to assign yellow to the element. In the end the main view should look like this:
Now we will create a slider for manual parameter variation. In the list of view elements, select as new object type 'Vertical bar' and create an object of this type. The parameter selection dialog appears again and you should select again the silver thickness parameter. In the following color selection dialog, select yellow. Finally set the slider range. The minimum is 0 and the maximum 50. Change the 'No assignment yet' text to 'Ag thickness [nm]'. Finally move the new bar to the left side of the main view and try to re-size it as shown here:
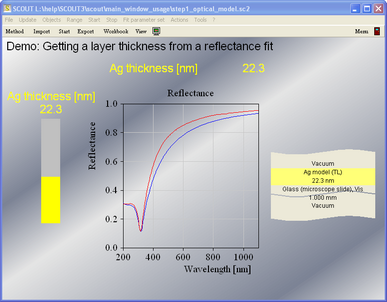
You can now use the mouse to move the parameter value by the slider position.
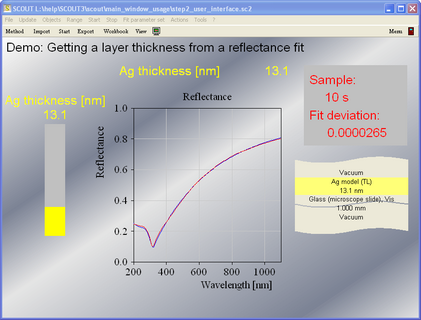
Use the Import button in the toolbar to load a new experimental spectrum. First you are asked for a sample name. Enter '10 s' (10 seconds sputtering time)
and select the spectrum ag_10.std:
Try to fit the thickness manually with slider motions. Then press Start for an automatic fit.
Now, as an exercise, we do several steps at a time. Generate the following view elements:
•An object of type 'Rectangle' (this should product a gray background for the following items)
•A 'text view' object called 'Sample:'
•An object of type 'Sample view' (this will display the name of the sample
•A text view object called 'Fit deviation:'
•An object of type 'Deviation view' (this shows the mean square deviation of model and measurement)
Try to get a main view appearance similar to the following:
In order to make the work with this method as simple as possible we will hide the menu when the configuration is loaded. This is done by de-activation of the menu option File|Options|Appearance|Menu visible at start.
We can also hide the toolbar items 'View' and the 'Autoscale button'. This is achieved by de-selection of the menu items File|Options|Toolbar|View button an File|Options|Toolbar|Autoscale button.
Once this is done, you should save the new configuration using the File|SaveAs command. When you load it again with File|Open the following main view should appear:
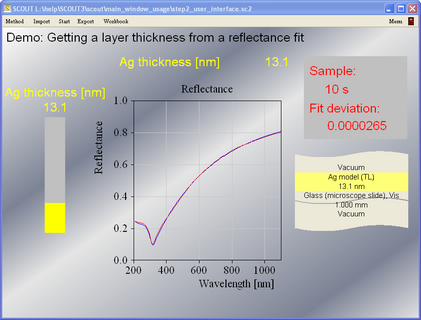
In the following chapter we will see how such a SCOUT configuration can be used by operators in order to analyze measured spectra.